"Apple and oranges..." by losy is used with permission.
Much Ado About 1-0, 0-1
Can hitters control how often they're "ahead" in the count?" Perhaps more importantly, does such a trait lead to better hitter outcomes?
By Tom Wike | June 14, 2025
Table of Contents
Intro
This article examines the effect of “getting ahead” in the count 1-0 vs falling behind 0-1. Starting with a ball or a strike. It will never be ready. As a site we’re named Anecdote Baseball and focus on cold-blooded sober analysis with all the data, yet inevitably baseball is still anecdotes. This article’s topic is but a thimble in an ocean of what-ifs.
Like, why did a hit happen? How was that run created or better yet, how do we best create those runs? No metaphysics here, just a ponderance on whether getting good counts can facilitate that hit, or if it was always going to happen. How about that chess game between the pitcher and batter? Or is there even a chess game? There are so many fork-in-the-roads in just one plate appearance. The anticipation and reaction time required to hit at the big-league level resembles divination and compels us onlookers to marvel at the decision tree every pitch presents.
Looking inside? Up? For breaking stuff? Gotta be ready for the fastball. Waiting for your pitch?
We could never meaningly assess the whole, but how about that first pitch?
"Do you live in an iceberg?" by is licensed under Fair Use
Count% - Tip of the Spear, Iceberg, What Have You
The first pitch of every plate appearance has 3 basic outcomes: a 1-0 count after a ball, a 0-1 count after a strike or an outcome ending the PA like a hit, out or HBP. This is our fork-in-the-road. How often do these three outcomes happen and what if anything do they tell us about overall success in this hit-ting?
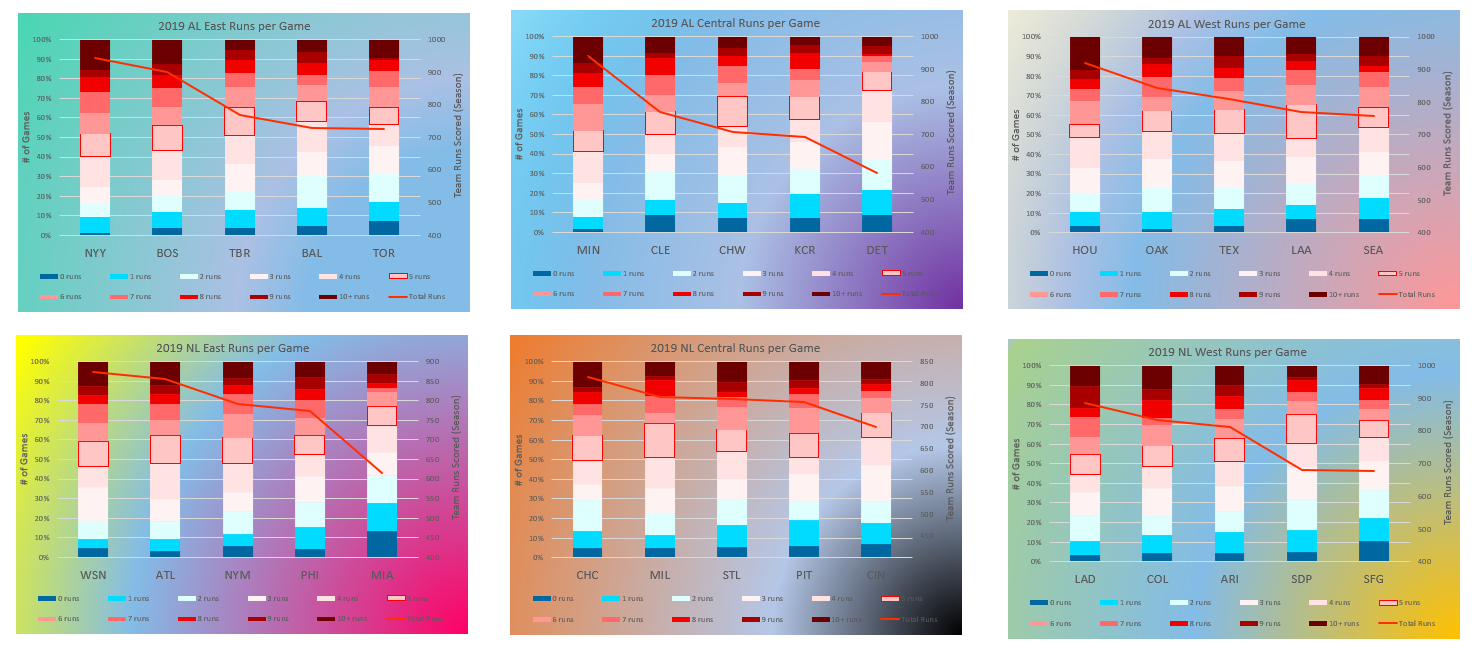
Below is an interactive table of every first pitch in MLB from 2010-2019. So something like 1,848,938 PAs. It shows the three outcomes' frequencies as a # and % and then triple-slash lines (BA/OBP/SLG) after these PA played out.
"1-0, 0-1 and First Pitch 2012-2021" | Count Splits data from bbjb jj jj aja j adjadsfja djjj dsaj fjf f f f f f f f f f Baseball Reference | Slicer by Anecdote Baseball
So, a .826 OPS after 1-0 counts, .612 OPS after 0-1 counts and .906 OPS on the first pitch. Usually, that’s three very different classes of hitters.
Now this article isn’t much more committed to this alternative world than the table above. The contexts to set-up are too many. Still, I think there’s clearly some truth to the numbers above: be ready for a first pitch strike or bask in the advantage of taking a ball for 1-0. Just how anecdotal this macro-data is to any one situation or player though, does seem like a balanced argument. It’s perhaps unprovable in baseball, lost between randomness and the butterfly effect. Old-School baseball folk have described with increasing clarity this idea of the mis-mash average of the whole not being the most scientific approach to take in every situation. Blake Snell’s short outing in Game 6 of 2020's World Series has been big fodder. The pendulum’s movement to and fro brings about a better brand of baseball.
On the Effects of a .203 Gap in SLG
Below there are two charts for two Hall of Fame caliber players: Frank Thomas and Omar Vizquel. Vizquel was a darling HOF candidate to me for most of my life, but between his domestic assault charges, a modern reassessment of his glove and a meager bat despite nearly 3,000 hits, he’ll rightfully miss out. Omar hit 80 HRs in his career, good for a paltry .352 SLG but played a sensational Shortstop.
The Big Hurt instead slugged 521 HRs for a .555 SLG while commanding one of the best eyes in the majors. He’s one of four hitters in MLB history with a .300 career AVG, 500 HR, 1,500 RBI and 1,500 walks. Thomas is both a great and not so great example of a hitter's ability to elicit ball one. That stunning eye and obscene power were different factors that contributed to a higher rate of ball one. Therefore he's a great candidate in that he proves some hitters get ball one more, but also not so great because with two or more factors contributing to him starting 1-0 more often, we can’t isolate how much effect each of those traits had.
I'd really be in love with these charts if their hover capability was better. You need to know what kind of damage each hitter did in those three situations: first pitch, starting 1-0 and starting 0-1. I don't see why each section of the pie can't have additional information like a slashline or PA total.
Click the button to change the years selected below. Unfortunately, the "slicer button" for years selected below CANNOT be tied to both charts. It can, but Excel online doesn’t support that, so each chart has its own (redundant) slicer. Sorry. I guess that opens the analysis up to other examples over different time periods. Notice Frank Thomas increased likelihood of starting an At-Bat 1-0 compared to Vizquel.
---------------------------I’ll leave this here for now. Despite my humility or paralysis in the face of this Count% stuff, I’ll be sure to touch on more examples and applications of it. Rickey Henderson sure seems like great candidate. What to make of these numbers? Thanks for reading and asking questions everybody! Stay involved, be awesome.
placeholder Caption and link text
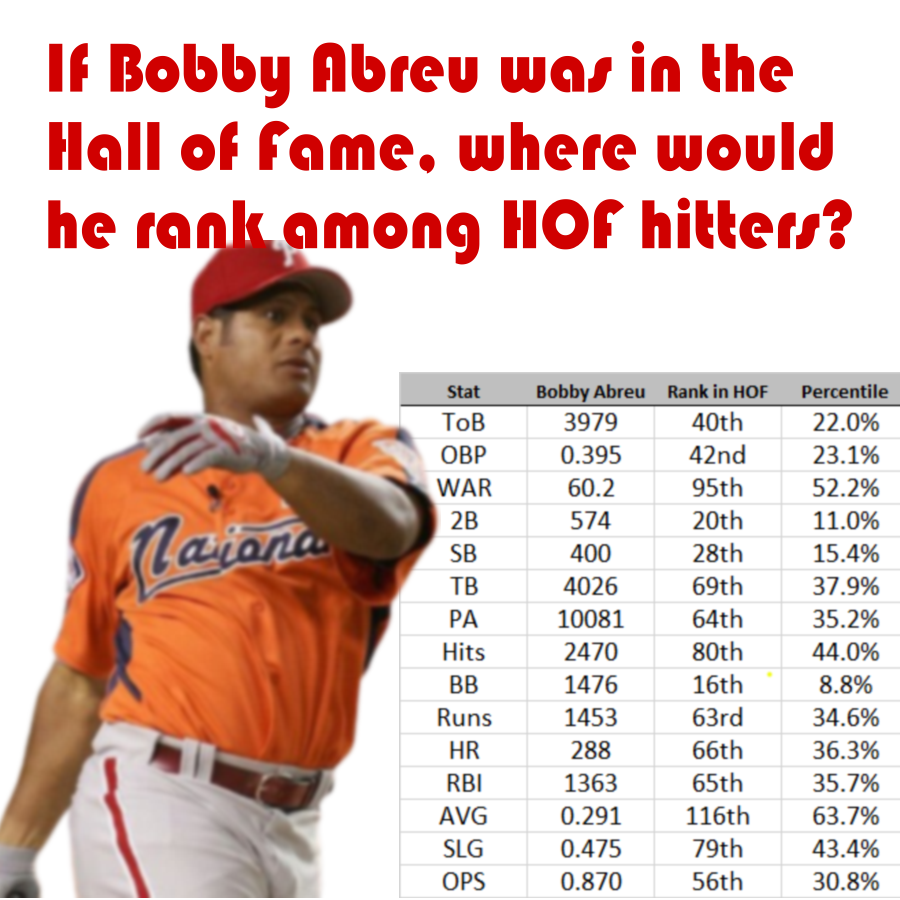
Great Hitter: But is it enough?!?!
We're spitting limerics here. Forlorn is the the fate of this mortal prefered to many HOFers.
By Tom Wike | 2026-02-04
MLB Buckets - 2024 and 2025
Hitters by 1/10th. 182k Plate Appearances split 10 ways.
By Tom Wike | 2026-01-21
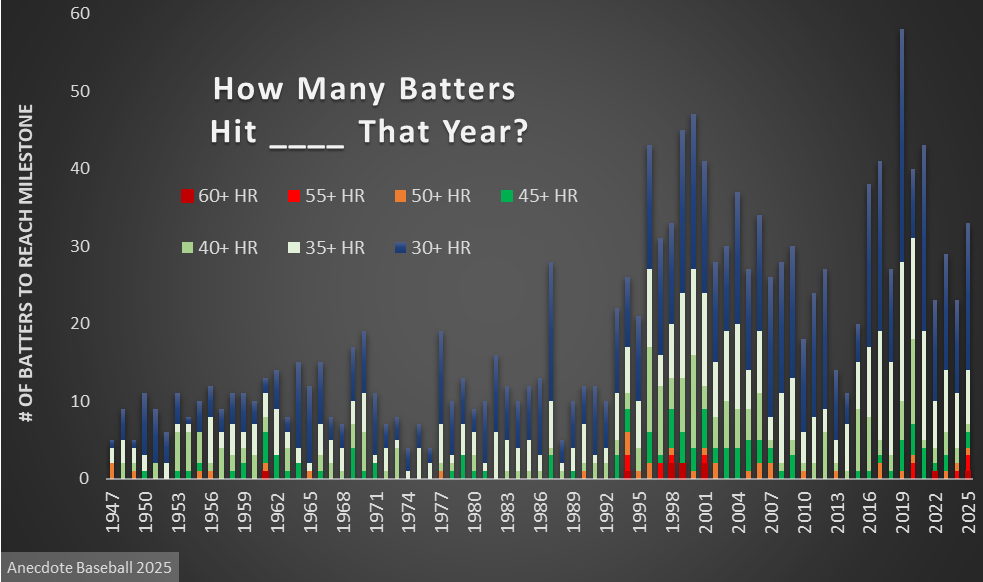
2025 HR Milestones
With 2025 data in tow, we update the big Home Run demography chart.
By Tom Wike | 2025-12-09

Bryan and Cy - Going Deep Into Games
In an age where folks say starters don't go deep enough into games, Bryan Woo joins the Cy.
By Tom Wike | 2025-08-31