Original chart by Anecdote Baseball
2019 Team Run Scoring Distribution
In what is becomming outdated current research, this series showcases the frequency team's score 1, 2, 3 or 10 runs.
By Tom Wike | June 16, 2025
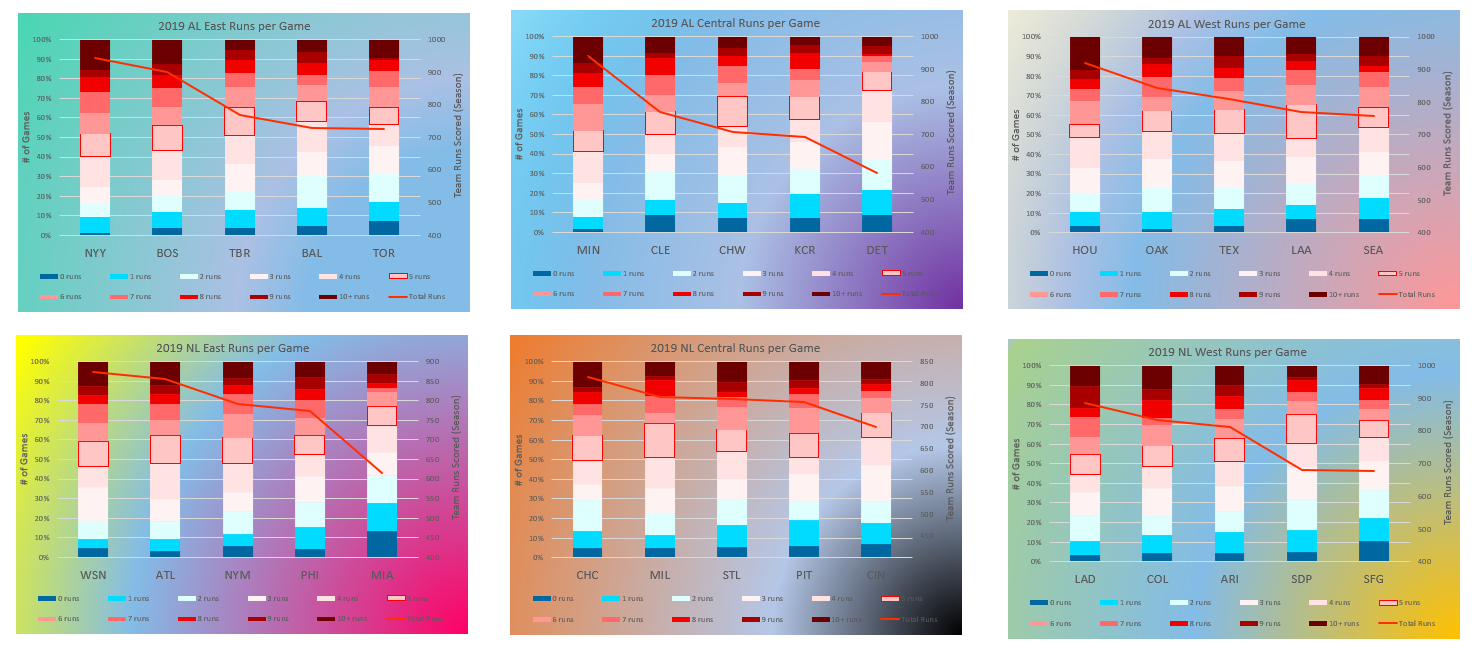
This article details teams' run-scoring profiles. How many runs did they score? How frequently did they get shutout or score 1, 2, or 3, etc. runs in a game? Candy color shading has been provided. Teams are organized by division and sorted from most Runs Scored to least. On the Left-hand side, the frequency of different run totals is charted. Each season of course totals 100% of games played and hopefully good offenses have a large % of their games in the 5, 6 or even 10+ runs category. On the Right-hand side, total runs is charted with the red line graph showing this data. 600 runs is terrible. 800 is good. 900 great while 1,000 is a little obscene. Seven teams since 1901 have scored 1,000, four of which were in the 1930s.
When a team "averages" 4.5 runs per game, how does that look as a distribution of those 729 or so runs?
The 2019 season is used. Yes, it was a rather abnormal year with a historic amount of home runs, but this research is where the research came from. We'll have to pick it up and standardize it for other seasons.
2019 AL East chart by Anecdote Baseball
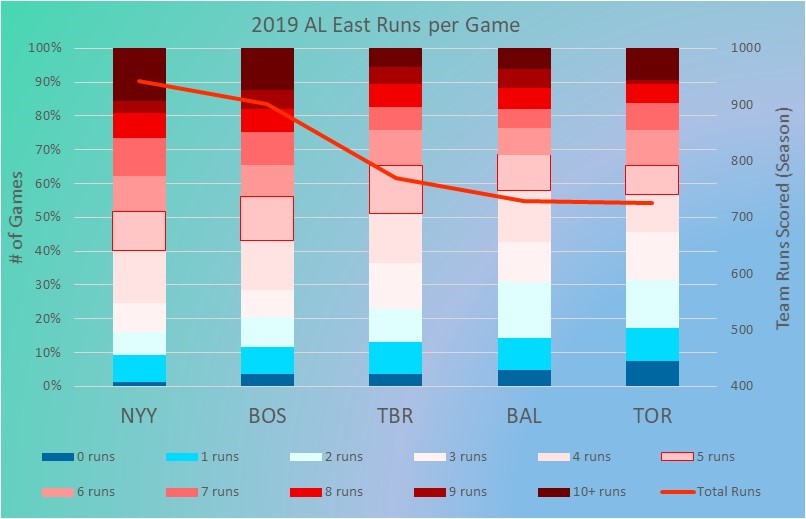
2019 AL East
The AL East is traditionally a powerhouse and this chart is no exception...
The AL East is traditionally a powerhouse and this chart is no exception. The original printings of these charts didn't have a standardized left vertical axis for Team Runs Scored and it was the AL East of course which had a higher top-end. New York and Boston both scored over 900 runs which is an enormous number, the 4th and 7th highest since 2003 respectively.
2019 AL Central chart by Anecdote Baseball
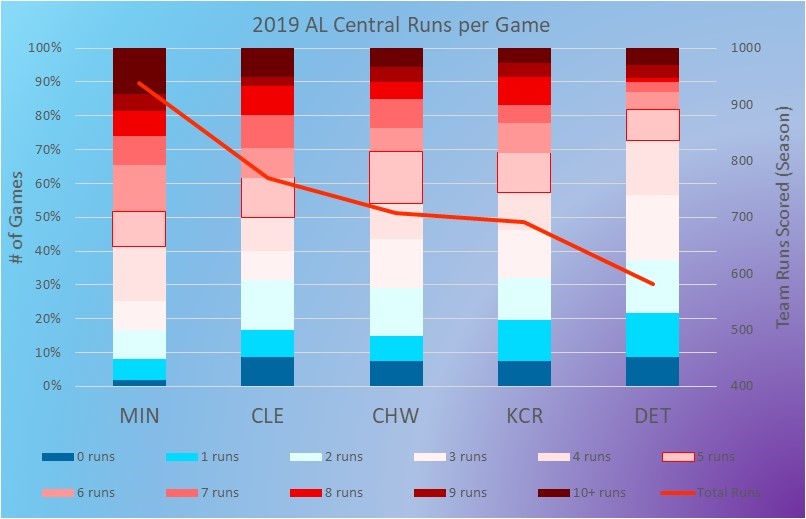
2019 AL Central
Here you see a higher rate of loooow scoring games. The Detroit Tigers score 0 or 1 run in over 20% of their games---up that to a mighty 2 runs and it's over 35%! This writing is as much future musings from 2022, because back in '19 the Minnesota Twin (yes the Minnesota Twins!) set a MLB Homerun record with 267 bombs. Unbelievable. As a result, our red-line for runs scored had a huge range from their 952 runs to Detroit's 604. Teams won't struggle to repeat Detroit's line, but if this chart is to be standardized, I don't see alot of charts going up high into the 900s like Minnesota so resolutely did.
In the middle, CLE, CHW and KC all have similar runs scoring profiles, with KC just gettin 0 or 1-runned about 5% more. Ideally a team has its red box (5 runs) sitting very low on its bar. Everything above that is 6+ runs, so if their box sits low like the Twins, that means they're scoring 5+ runs like 60% of the time. So the red-line representing runs counter to the "line" created by the 5 runs boxes, making something of an X like shown here. Great offensive teams like the Twins have a high-run total, far above their 5+ runs box. They'll have very little blue or bad offensive games. In 2019 the Twin were shutout only 2 times!
This was the first chart and coming back to this, seeing the trends within a franchise might be most telling. Each team's position left to right will be arbitrary (?) moving forward---I think this is best and necessary. Otherwise, meaning chart to chart is absent unless you absorb the new positions. Instead, they'll be standardized to see a single franchise's evolution chart to chart. This invites the need for just one franchise chart over a decade rather than vs a single year's divsion. Those will be coming. Dang, as always the pandemic puts a wrench in this data as the inception year of '19 is immediately followed up with moot data. '21 and '22 will be incoming, giving us some year-to-year trends to look at!
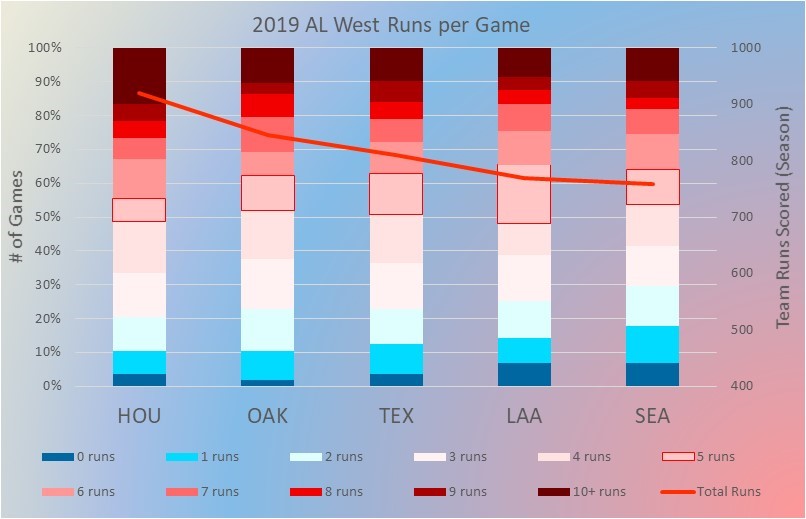
2019 AL West chart by Anecdote Baseball
2019 AL West
These
American League
2019 AL East chart by Anecdote Baseball
2019 AL Central chart by Anecdote Baseball
2019 AL West chart by Anecdote Baseball
National League
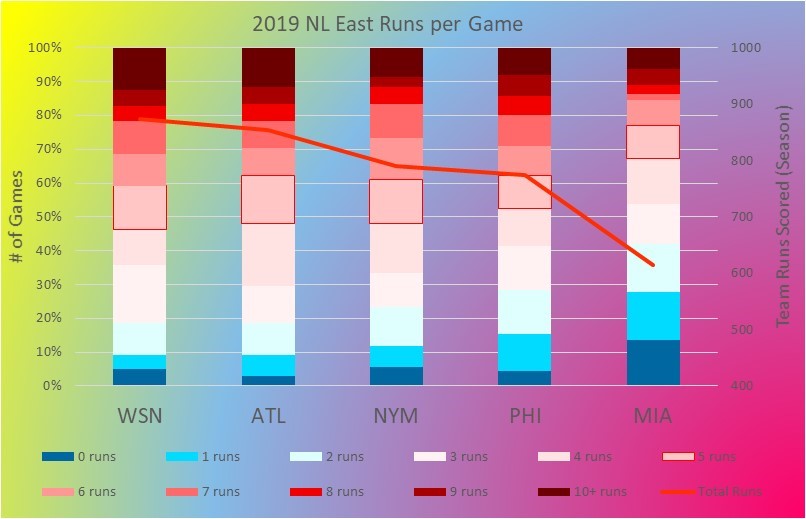
2019 NL East chart by Anecdote Baseball
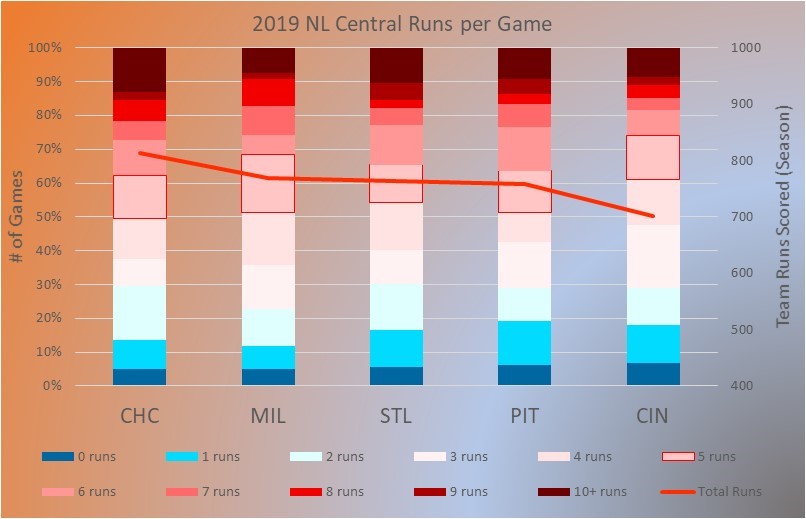
2019 NL Central chart by Anecdote Baseball
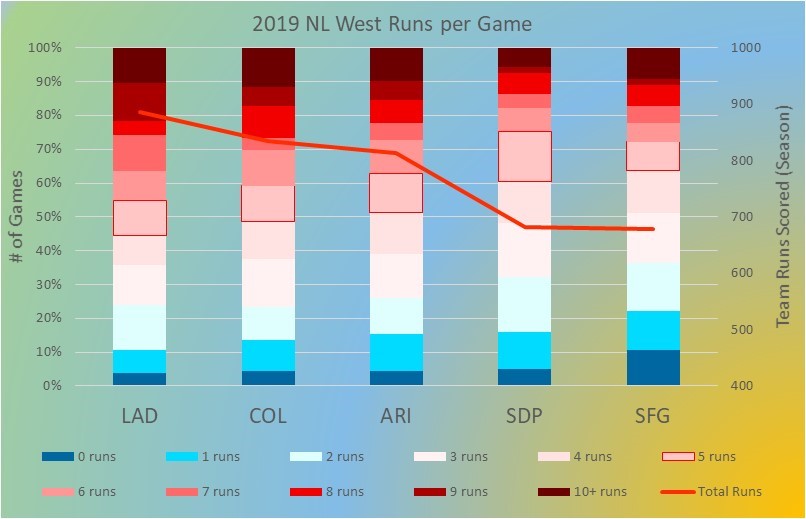
2019 NL West chart by Anecdote Baseball
placeholder Caption and link text
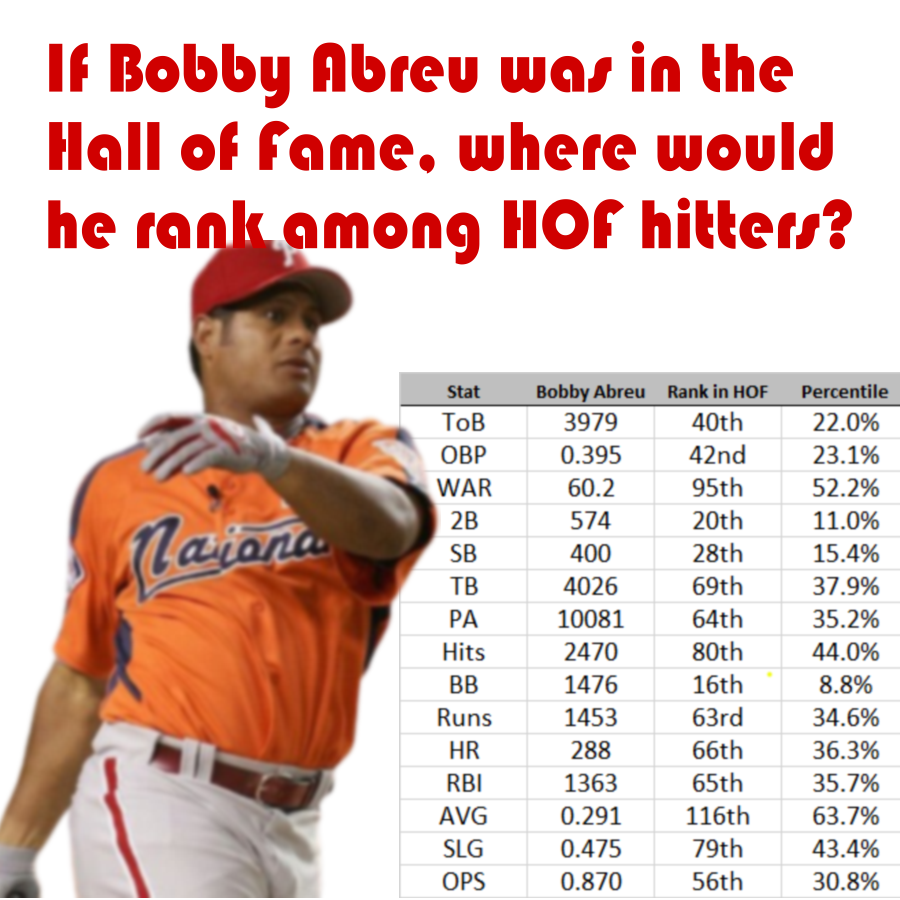
Great Hitter: But is it enough?!?!
We're spitting limerics here. Forlorn is the the fate of this mortal prefered to many HOFers.
By Tom Wike | 2026-02-04
MLB Buckets - 2024 and 2025
Hitters by 1/10th. 182k Plate Appearances split 10 ways.
By Tom Wike | 2026-01-21
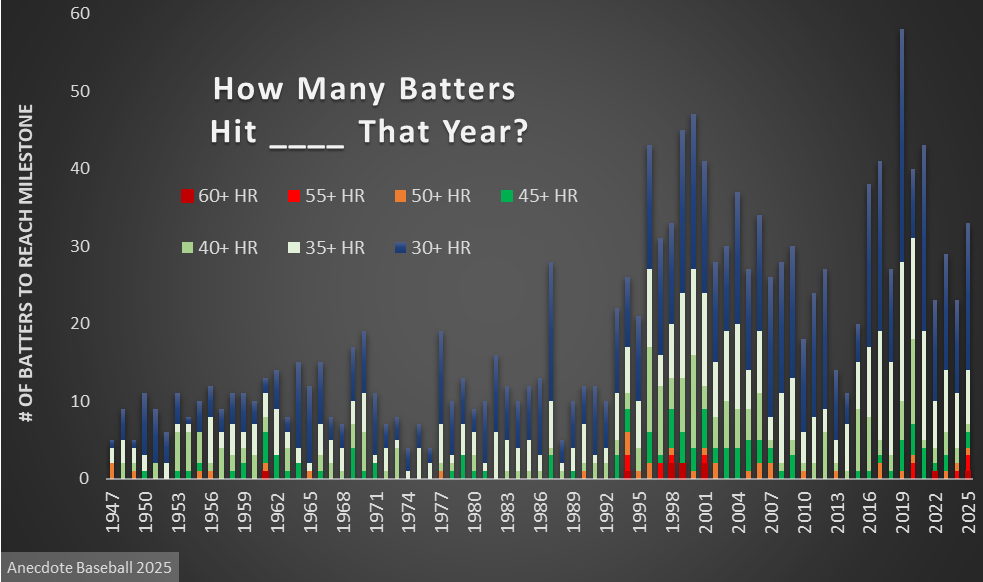
2025 HR Milestones
With 2025 data in tow, we update the big Home Run demography chart.
By Tom Wike | 2025-12-09

Bryan and Cy - Going Deep Into Games
In an age where folks say starters don't go deep enough into games, Bryan Woo joins the Cy.
By Tom Wike | 2025-08-31
