Original picture by Anecdote Baseball
MLB Catchers Since 2002
How has Catchers' production changed if at all since 2002?
By Tom Wike | June 16, 2025
About Catchers since 2002
The chart below shows MLB catchers' averages for OPS and HR per 600 PA. While catchers' production in OPS has remained relatively stable, it is on the back of an increase in HR. The result: declining AVG and OBP from catchers.
There is so much to unpack in this. A promise to the site is we'll circle back, dig deeper, once the site is live. For now, here are some follow up questions to later touch on:
- Where have the Plate Appearances come from? How is it distributed between "starters" and backups?
- What's most different from the past? The top end, the middle or the bottom?
- How much of all this (i.e reality) comes in Salvador Perez's wake?
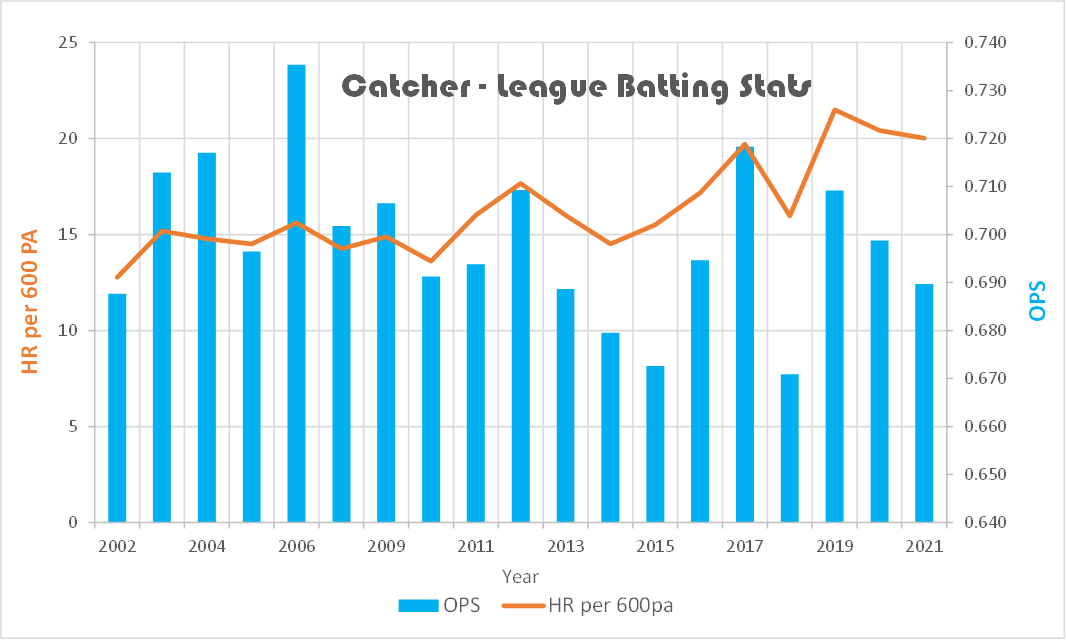
"Catchers - League Batting Stats 2002-2021" by Anecdote Baseball | Data: Stathead Chart: Anecdote Baseball
placeholder Caption and link text
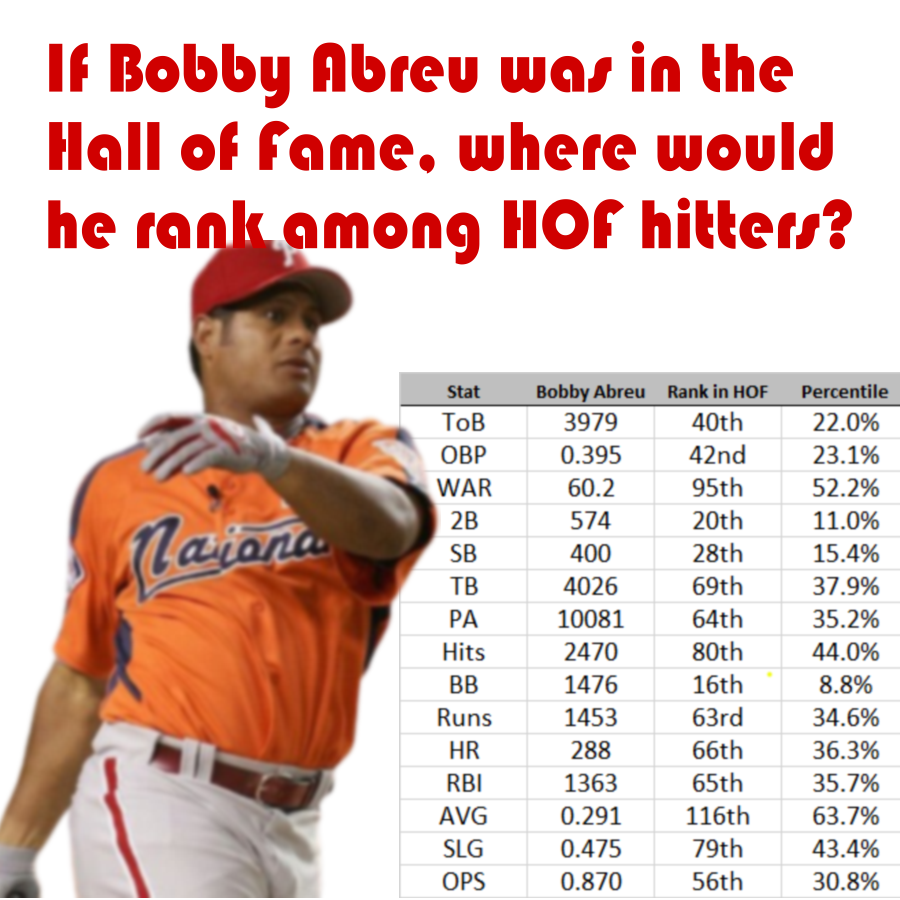
Great Hitter: But is it enough?!?!
We're spitting limerics here. Forlorn is the the fate of this mortal prefered to many HOFers.
By Tom Wike | 2026-02-04
MLB Buckets - 2024 and 2025
Hitters by 1/10th. 182k Plate Appearances split 10 ways.
By Tom Wike | 2026-01-21
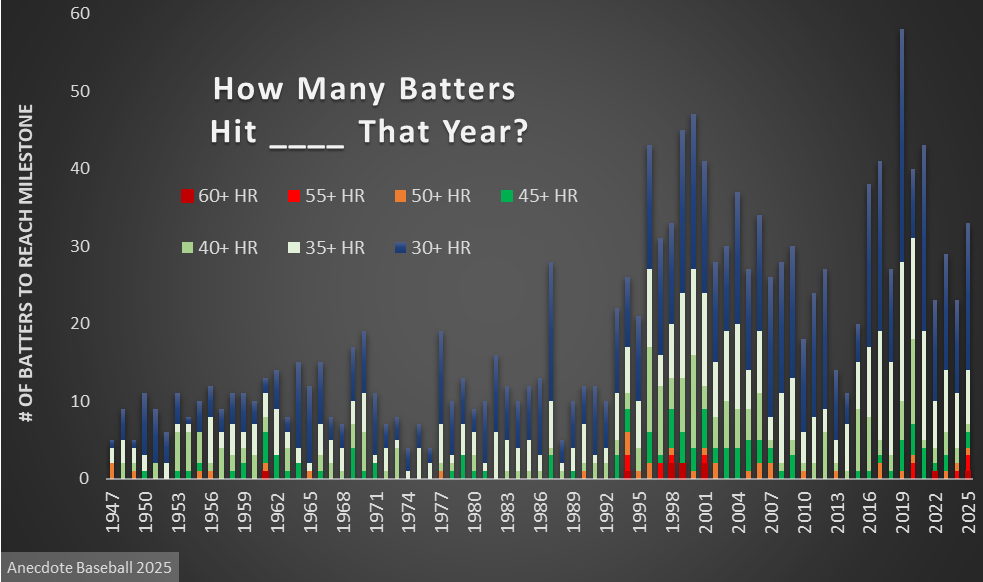
2025 HR Milestones
With 2025 data in tow, we update the big Home Run demography chart.
By Tom Wike | 2025-12-09
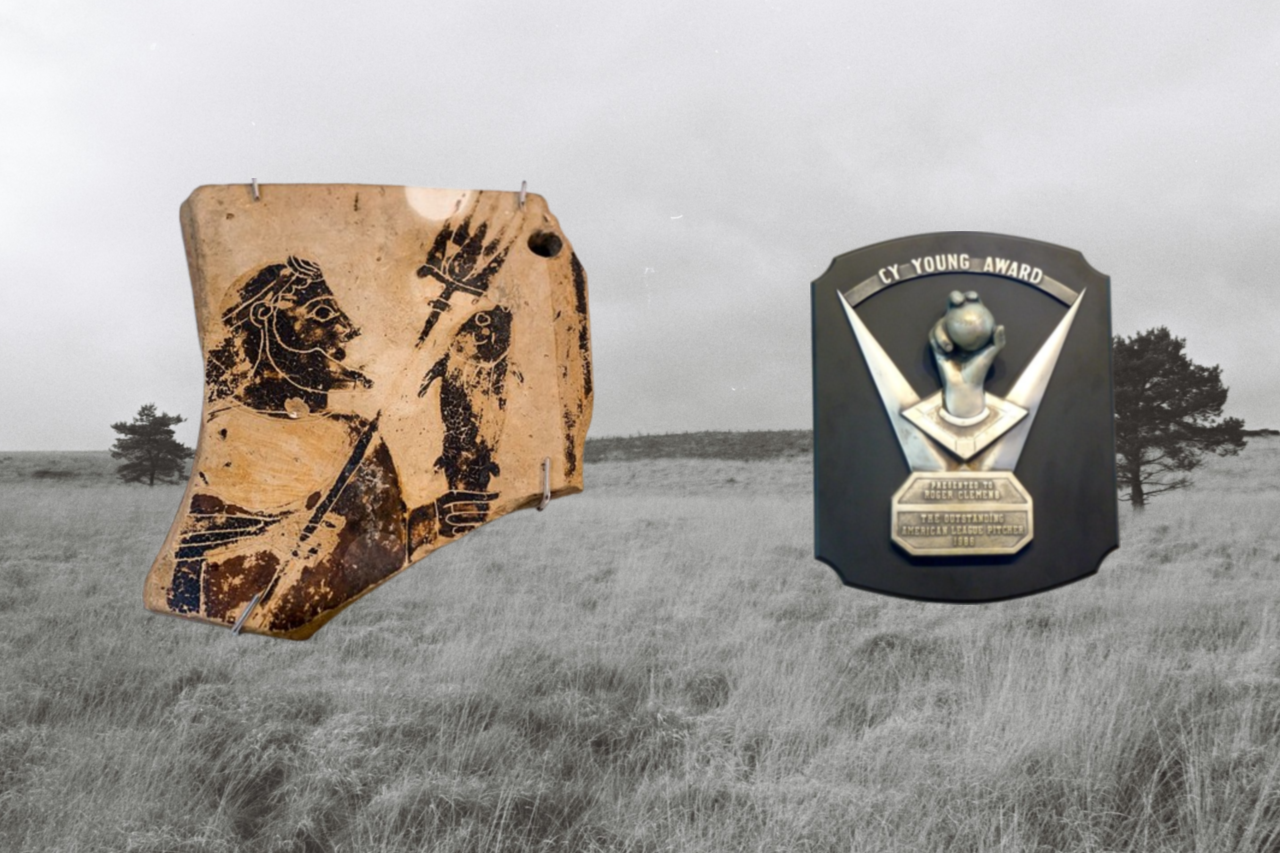
Bryan and Cy - Going Deep Into Games
In an age where folks say starters don't go deep enough into games, Bryan Woo joins the Cy.
By Tom Wike | 2025-08-31