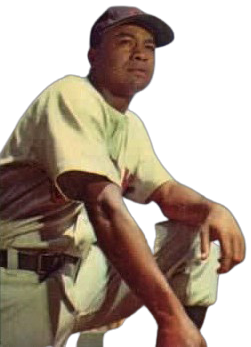
"T206 baseball card of Gavvy Cravath" is in the public domain.
HR Demography: Milestones Over Time
That there’s Gavvy Cravath. The King of the Homerun until one Babe Ruth came around, or at least started taking hitting seriously. This article charts how many batters topped certain HR milestones all the way back to even before Gavvy. So, how many 30 HR seasons happened in 1920? 1951? 2019? Let’s go!
By Tom Wike | June 14, 2025
Table of Contents

"Davoser Cafe" (1928) by Ernst Ludwig Kirchner, 1928. In Wikipedia Commons.
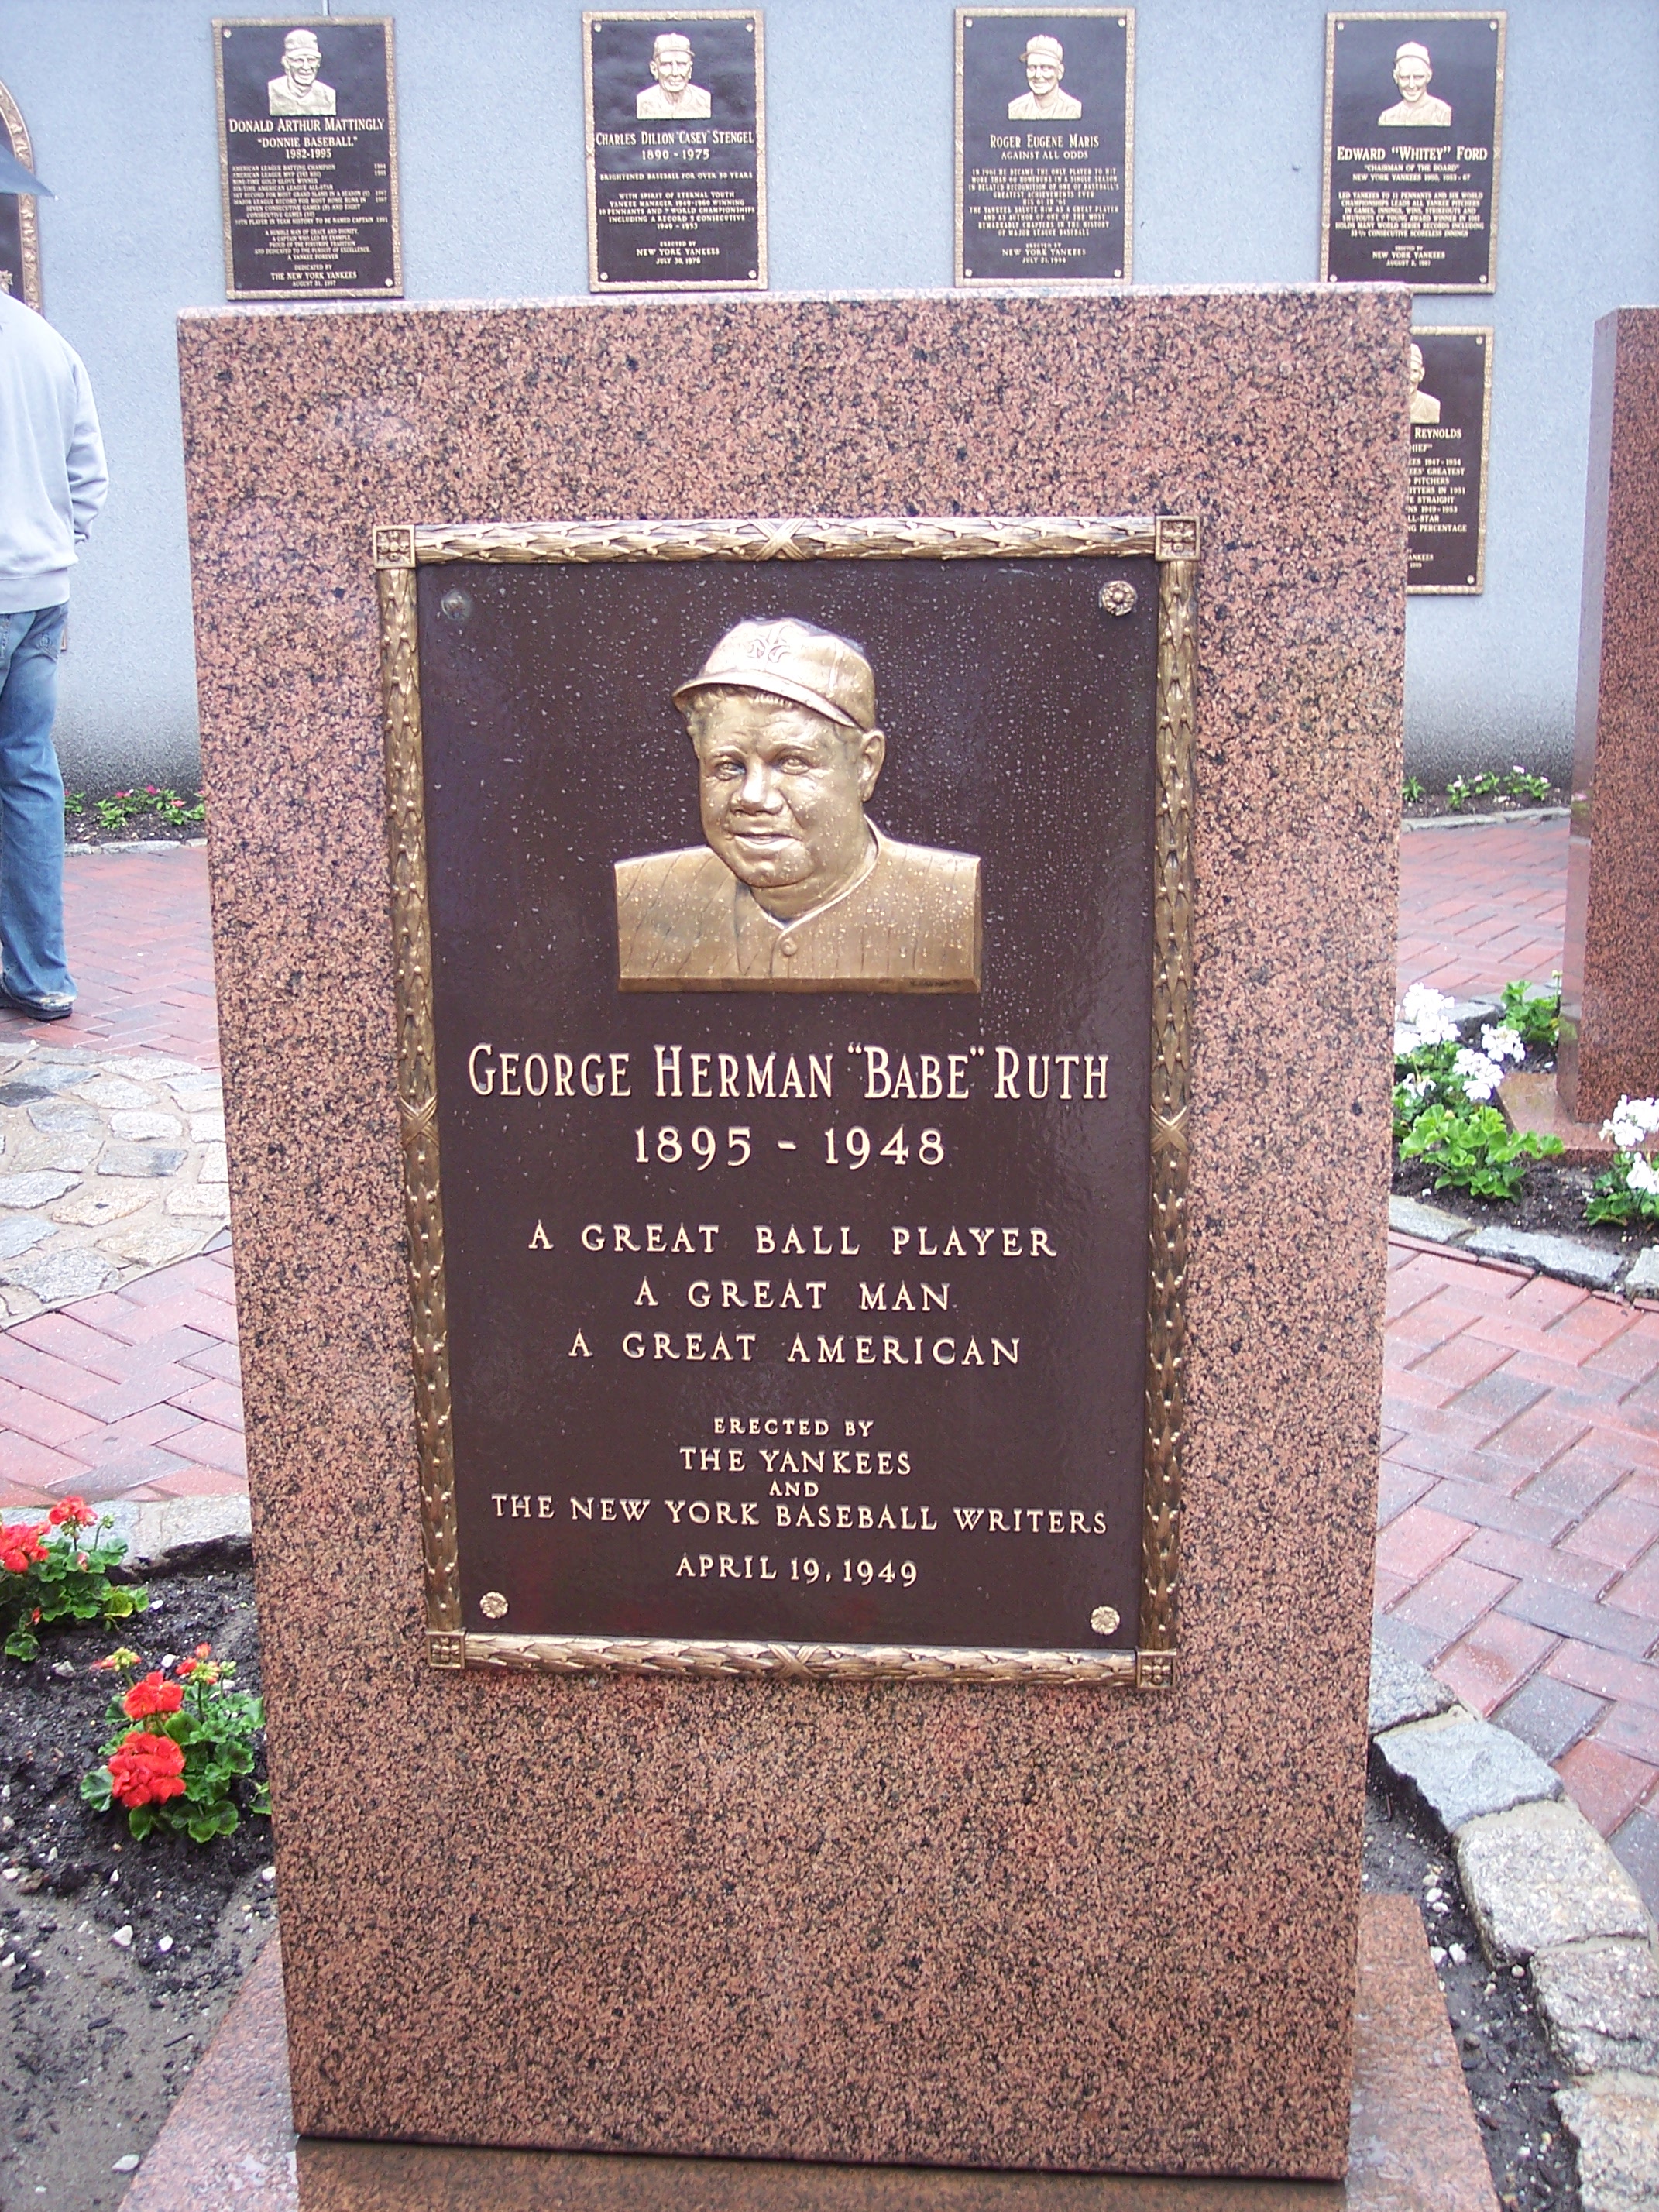
Before the 1920 season, the Boston Red Sox sold Babe Ruth to the New York Yankees. To that point, the 22-year old Ruth was not just a sensational left-handed pitcher but also possessed an emergent hitting prowess unlike any other. For the last two seasons, Ruth spent his off-days playing the outfield and added a new superlative to the game: Ruthian.
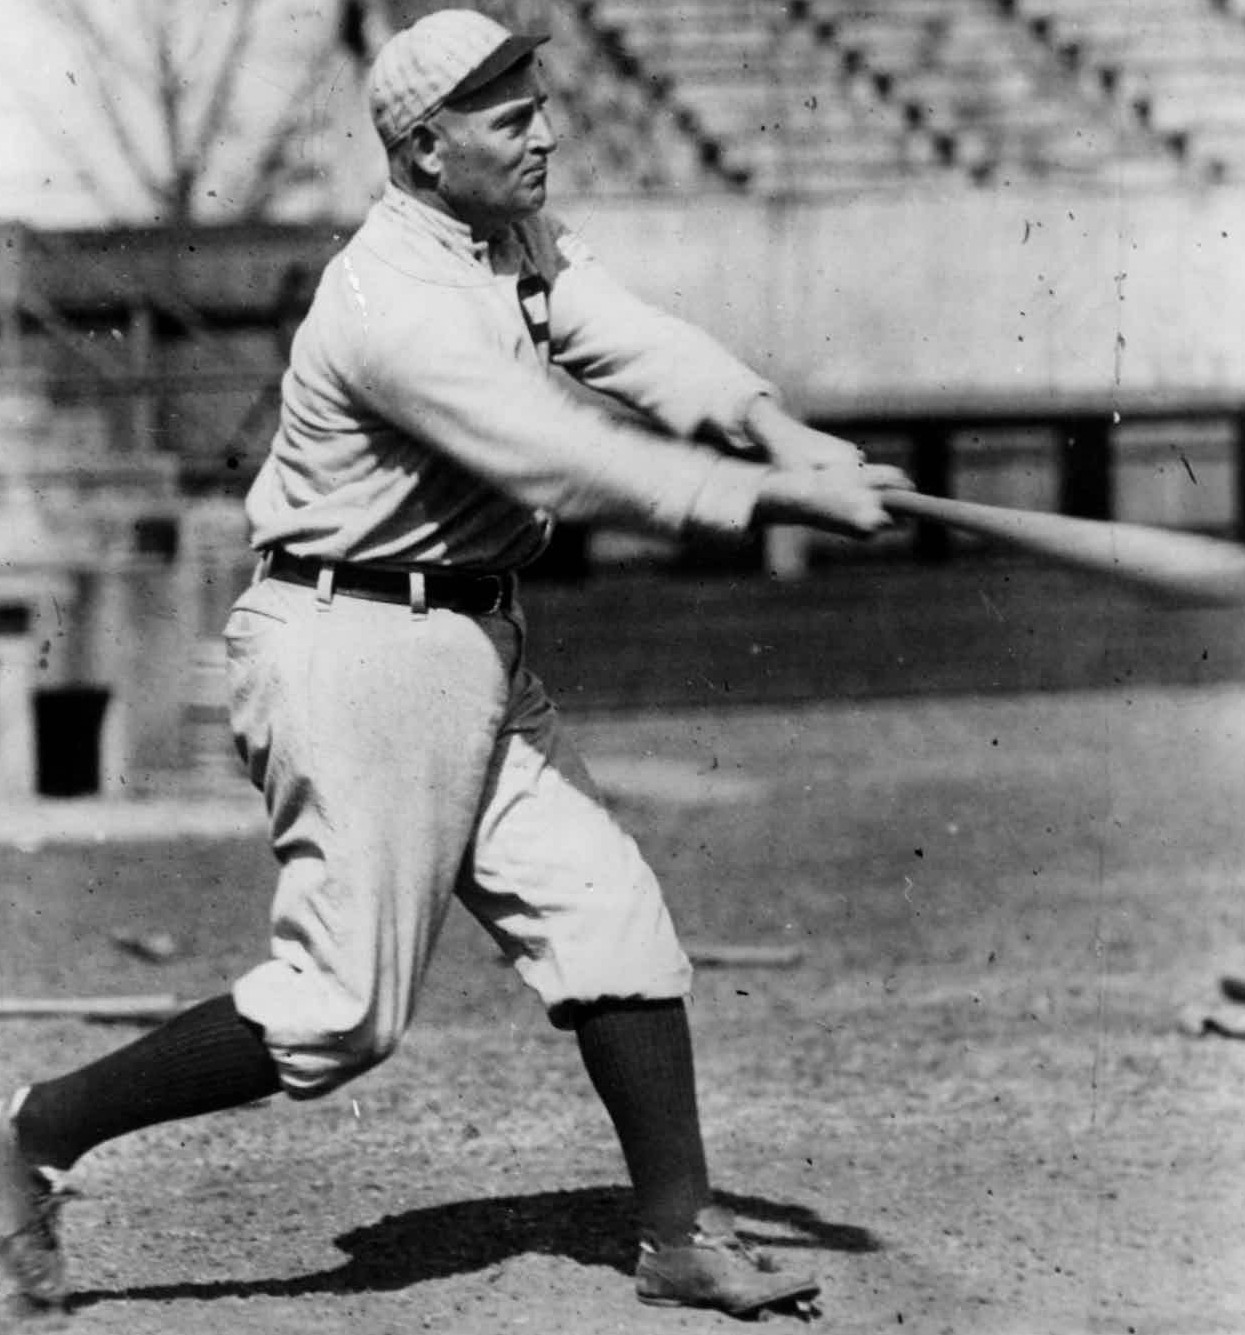
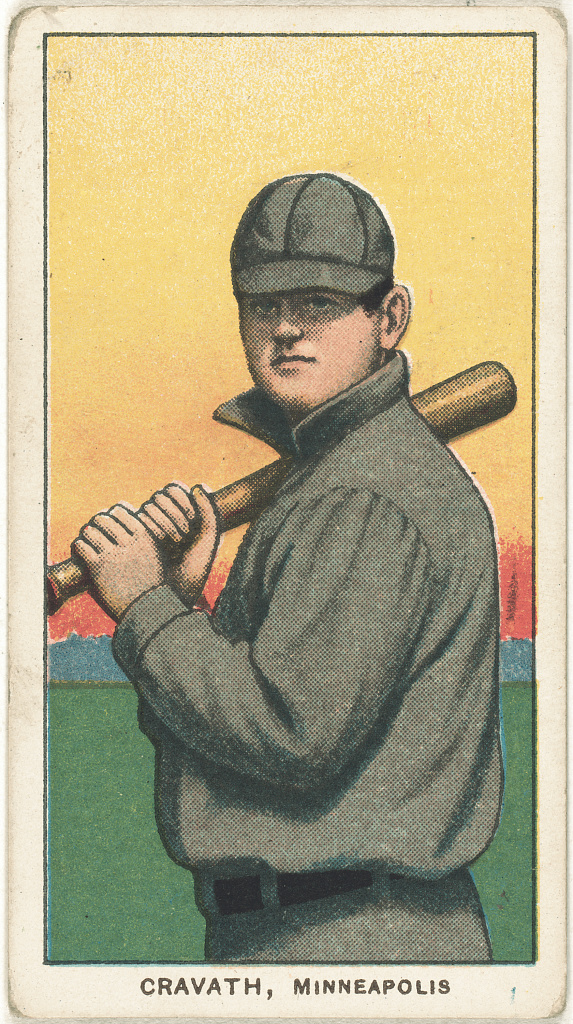
"Gavvy Cravath - Phillies (~1915-1920) by The Sporting News, Acme Photo. In Wikipedia Commons.
In his first year in New York, the Babe largely gave up pitching while hitting 54 home runs---more than any other TEAM in the American League. So, good trade-off. Thus began the “live-ball” era. History would conspire to liven up the ball in the 20s, with or without Ruth, but the Babe’s place in all of it was titanic. Enough to make him perhaps the most famous American?
"Yankee Stadiumeeehh" (1928) by Ernst Ludwig Kirchner, 1928. In Wikipedia Commons.
Alas, it could've been ‘ol Gavvy! Before Ruth’s experimental seasons in Boston and offensive displays in New York, our Poster-Boy Gavvy was King with a peerless 24 homeruns in 1915. He’d hit 19 total HRs in both ‘13 and ‘14, which was an explosion, pre-1920. 7 homeruns was often enough to lead the league. In 1918, Gavvy Cravath did lead the NL with just 8 HR.
Gavvy retired after the 1920 season as the All-Time Homerun leader with 119 Homeruns. The 25-year old Ruth’s mark stood at 103, more than half of which came coming during that revelatory 1920 season. He’d pass Cravath on June 10th, 1921. Gavvy became “Judge Gavvy" and presided over Laguna Beach while the Babe swatted 714 HRs.
From there, hundreds of 30 homerun campaigns have taken place. In select periods, sluggers have approached 50, 60, or even 70 homeruns!
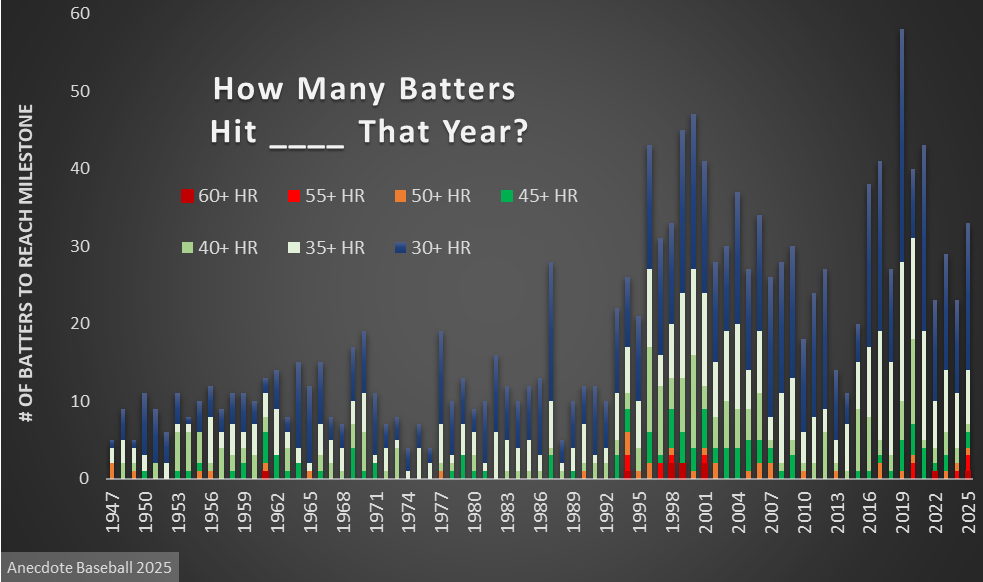
2019 was the 100th year since Ruth’s emergence and in it, a record 6,776 Homeruns were hit, which topped 2018’s short-lived record by a full 671 dingers. Many exclaimed that the prestige of a 30 HR season had been cheapened, the milestone commonplace. The frequency of HR milestones over MLB history is charted below and can speak to that. Every milestone in increments of 5 homeruns was tracked, so 10, 15, 20, etc all the way up to 70, which Mark McGwire and Barry Bonds topped around the turn of the Century. You can see those 55+ HR seasons below in Red.
Chart

Original chart by Anecdote Baseball.
Data
Below is all the data for this study, embedded as an Excel document. The first gold grouping is a tally of how many batters exceeded those HR milestones each year---the main product of this research. The number of teams in the league has increased and is tracked as well. Some may want to “pro-rate” seasons with less teams to see how many boppers would’ve cleared those markers if there were 30 teams like today. A multiplier is provided for this. For years with less than the normal schedule of games (1981, 1994 and 2020) a coefficient IS applied to multiply pro-rate players’ Homerun totals to a 162 game season.
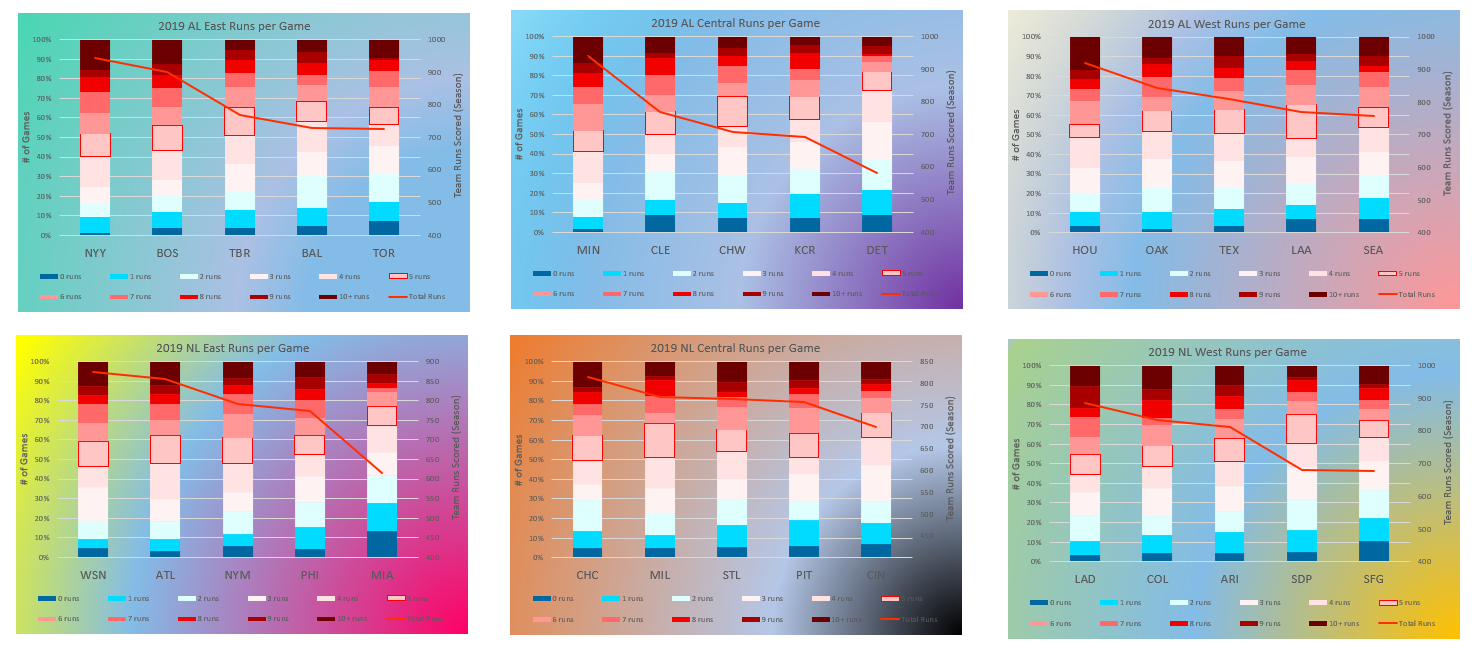
Purple, Red and Blue show information about the league run-scoring environment.
placeholder Caption and link text
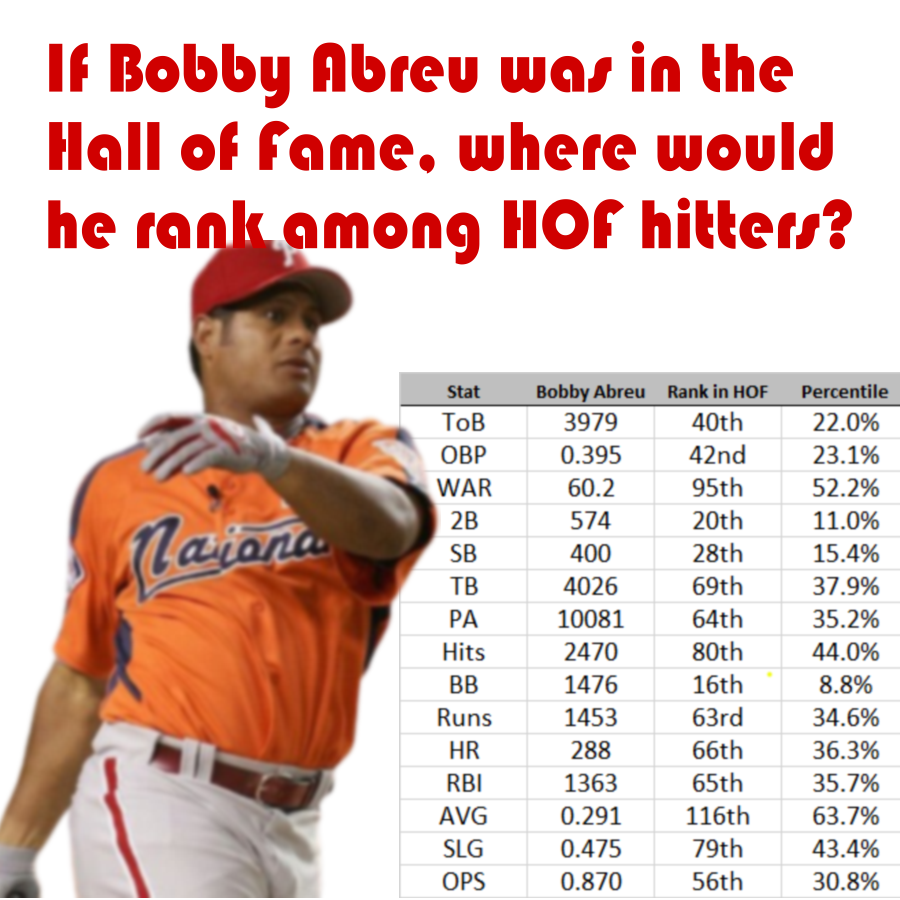
Great Hitter: But is it enough?!?!
We're spitting limerics here. Forlorn is the the fate of this mortal prefered to many HOFers.
By Tom Wike | 2026-02-04

MLB Buckets - 2024 and 2025
Hitters by 1/10th. 182k Plate Appearances split 10 ways.
By Tom Wike | 2026-01-21
2025 HR Milestones
With 2025 data in tow, we update the big Home Run demography chart.
By Tom Wike | 2025-12-09

Bryan and Cy - Going Deep Into Games
In an age where folks say starters don't go deep enough into games, Bryan Woo joins the Cy.
By Tom Wike | 2025-08-31