"The League in 10 Buckets" by Anecdote Baseball
MLB Buckets - 2024 and 2025
Hitters by 1/10th. 182k Plate Appearances split 10 ways.
By Tom Wike | January 21, 2026
2025 MLB
"2025 OPS Buckets" by Anecdote Baseball - 182,296 PAs - 0.245/0.315/0.404
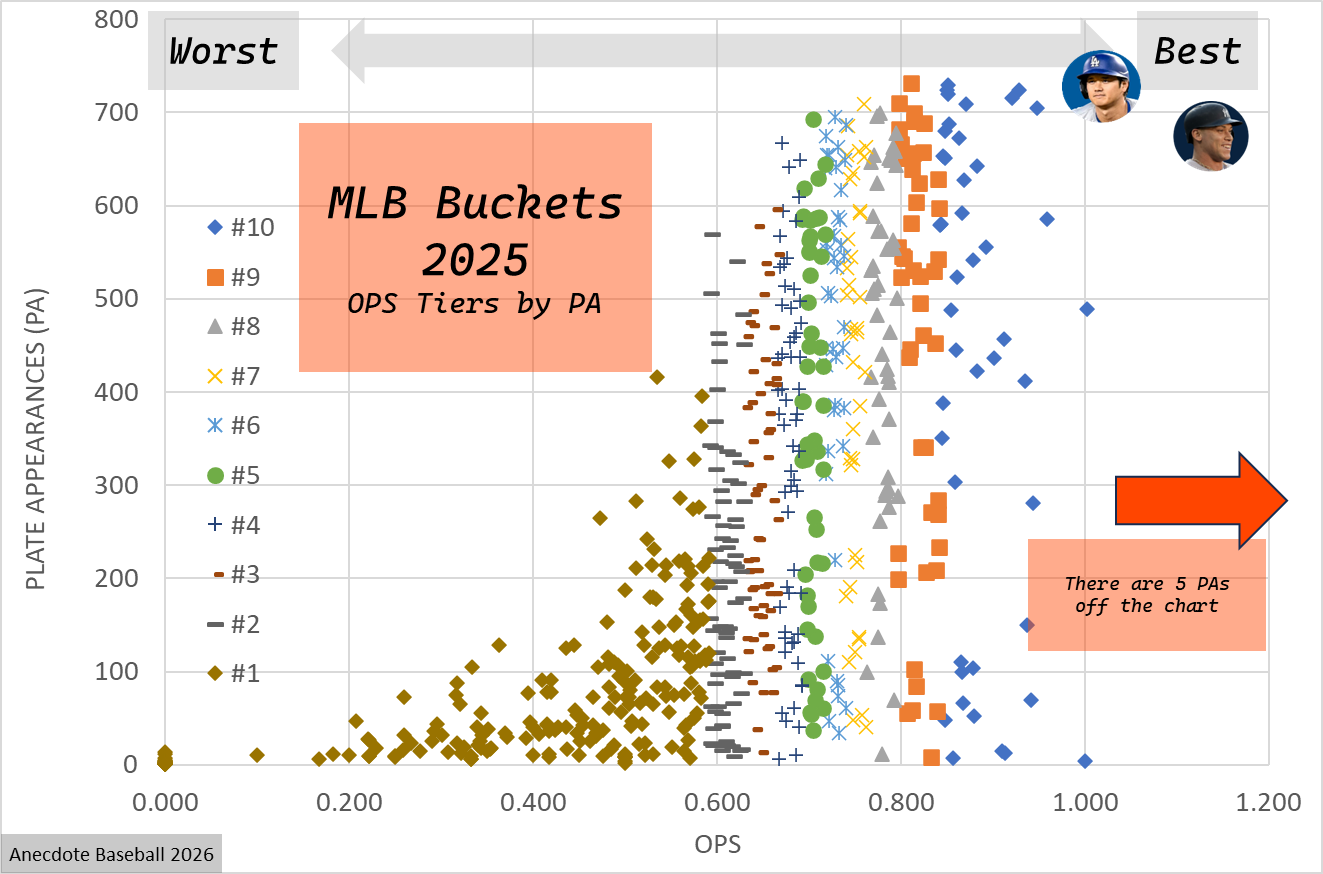
"2025 OPS Buckets" by Anecdote Baseball - Click to see the chart ~fullscreen!
2024 MLB
"2024 OPS Buckets" by Anecdote Baseball - 182,449 PAs - 0.243/0.312/0.399
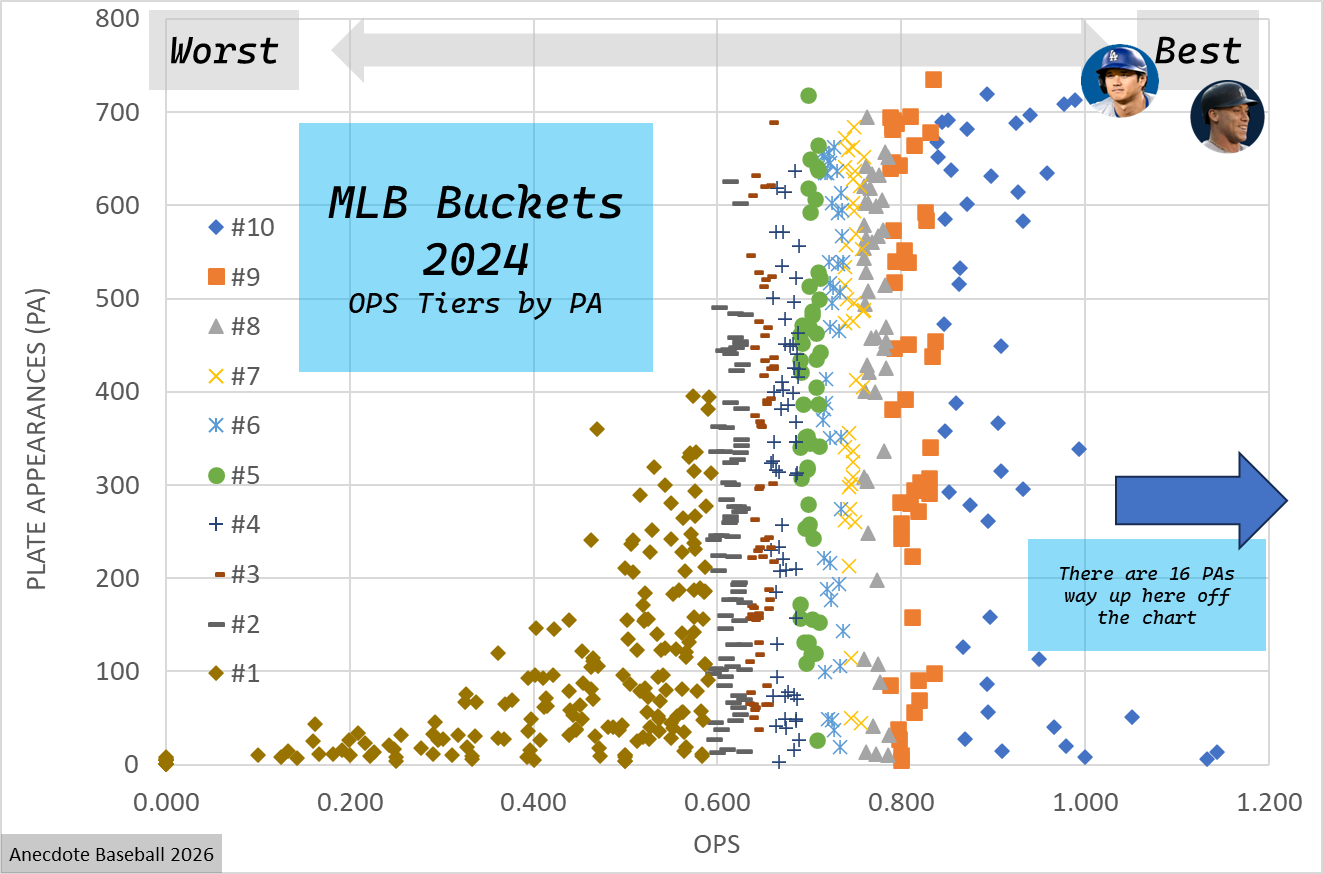
"2024 OPS Buckets" by Anecdote Baseball - Yes, Judge and Ohtani's dominance is this similar!
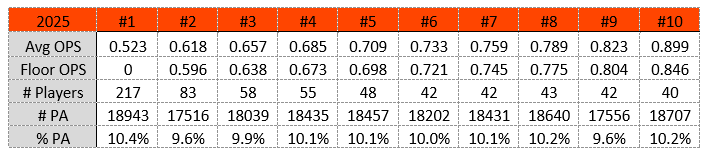
These charts are muted fate. Worlds of difference down to tiny fractions of a tiny chart. But that’s what happens when you make a fair chart that starts at 0, where there are more performances than up in the 1.000 OPSs with guys like Ohtani or Judge. This data splits all plate appearances in the league by OPS from their source into 10 buckets, or tiers. 182,296 plate appearances in 2025 which makes about 18,000 in each bucket. 1/10th of all PAs is a huge amount. That’s the starting hypothesis. Yet 1/10th of all PAs in MLB average a .523 OPS. That’s terrible. Respect to Major Leaguers.
I contend that teams concede these through an amalgam of PAs. Piecing together not-so good at-bats by starting non-veteran meh guys, because you want to see what they’ll do---or you need to play somebody. To concede 1,000+ PAs to guys you don’t have firm conviction in is the crime in baseball. Basketball, by contrast has so many scorers that can score 20+ point per game if given the opportunity. Baseball, with each batter being a whole 1/9th of the offensive game plan makes a lot of meh guys get a lot of opportunities. A good goal would be to stop giving PAs to guys in that bottom 10th and give them instead to someone in the top 8 or 9 tiers. New Years’ Resolution! But dang, if any of us could understand how intensely good Major League pitching is, the best of us might hit a little better. Not you or I, again we can’t understand.
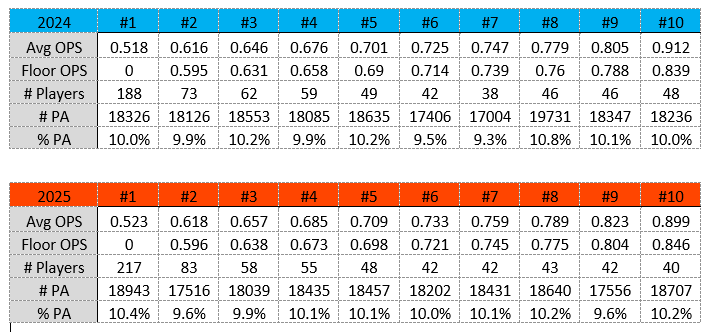
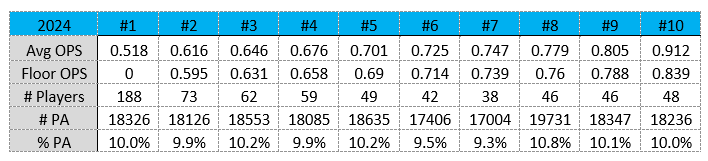
Players are ranked by OPS and split into ten buckets, each representing roughly 10% of plate appearances. Buckets can be slightly larger when there are ties at the cutoff—for example, in 2025 the top bucket included two players with a .846 OPS, pushing it to 10.2%. Subsequent buckets then begin at the next cutoff, maintaining 10% increments.
Look at how dreadful hitters in the 5th and 6th best tiers are though-----wait, those are the league average guys! .698-.745 OPS guys. That means 40% of all PAs in MLB, with a universal DH, are coming from hitters who ended the year with a year-end OPS of .697 or lower. 40%. New Year’s Resolution.
So, this amalgam of PAs. This is because teams have to, obviously. It turns out, it’s really hard to fill 6,000+ PAs for a team over that 162-game marathon. But how much must teams shamble together that last 10th? How can they avoid such leaky plate appearances? Depth, but also just better, more durable starters. Maybe that’s a star, but really it’s just paying for a Free Agent as opposed to just rolling with a mid 9th,10th 11th best position player. Go into a season armed to the teeth with good hitters rather than having four or five and calling it a lineup, just saying.
Youth is another counter to this, that the game needs so many new players every year and you’re just going to get a mixed bag from them. True, that’s just another critical thing a team needs to be good at. It is hard balancing the now and the future. Uncertainty is the name of the game in baseball. I don’t think it’s about increasing your performance in each 1/10th bucket as much as changing your participation rates in the various buckets. Less in the bottom dredges and just incrementally better where you can be.
So, is this data much ado about nothing, or a glimmer towards the gravity of baseball? Thanks for reading!

Tom writes, codes and designs the stuff on Anecdote Baseball. Enjoys long sims on the beach like Strat-O-Matic or PennantWars. Developing a mysterious baseball simulation and/or appetite.


placeholder Caption and link text
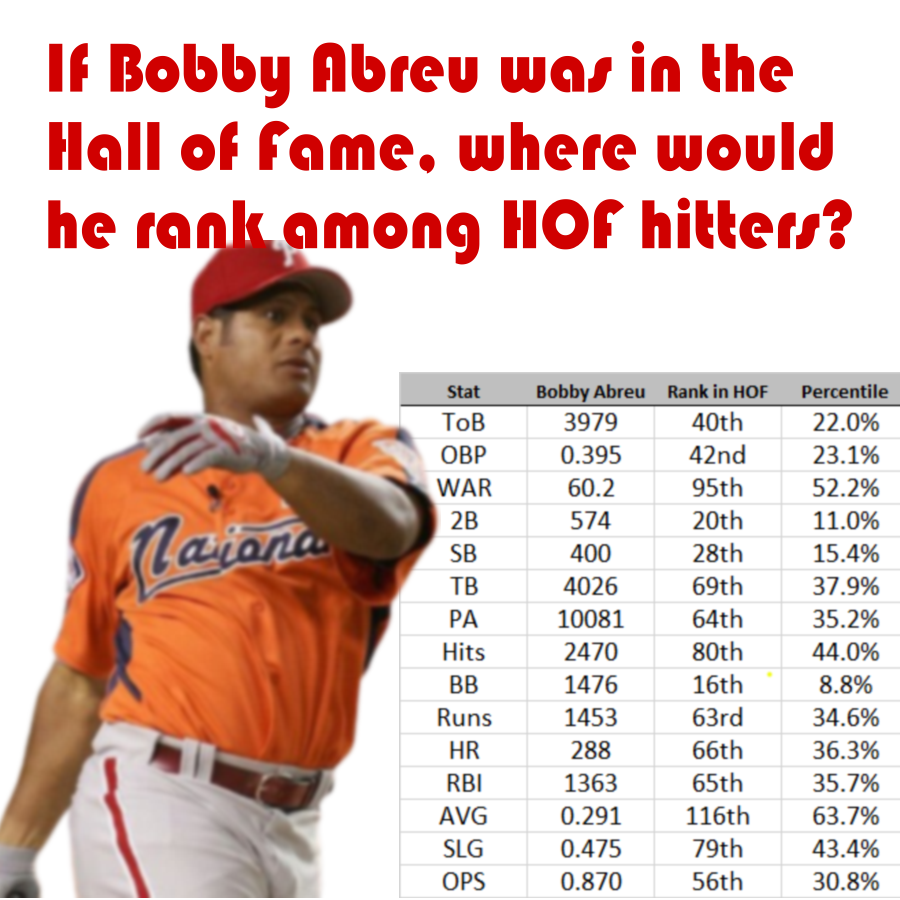
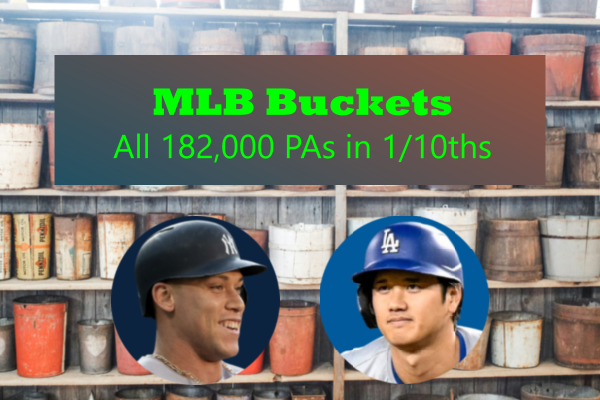
Great Hitter: But is it enough?!?!
We're spitting limerics here. Forlorn is the the fate of this mortal prefered to many HOFers.
By Tom Wike | 2026-02-04

MLB Buckets - 2024 and 2025
Hitters by 1/10th. 182k Plate Appearances split 10 ways.
By Tom Wike | 2026-01-21
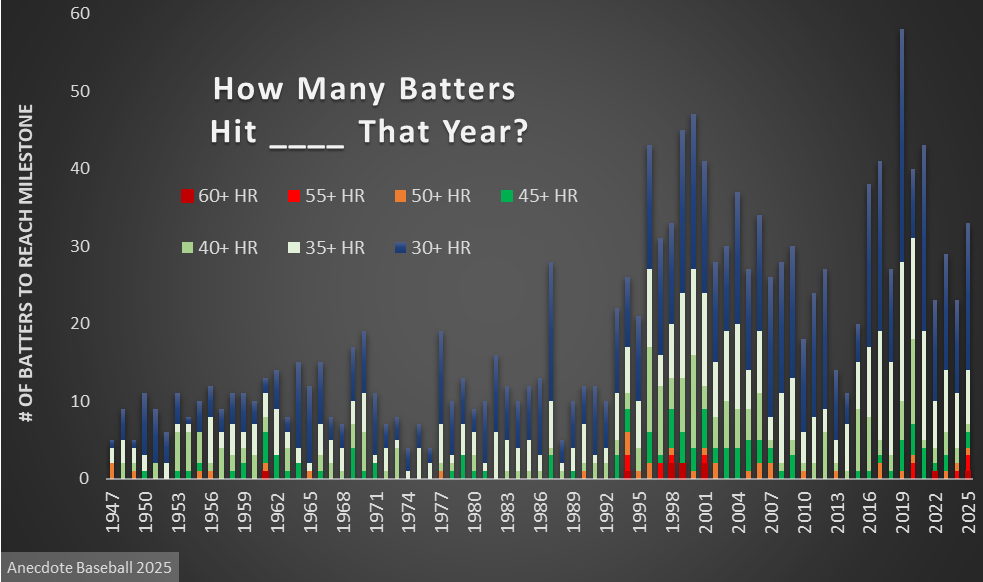
2025 HR Milestones
With 2025 data in tow, we update the big Home Run demography chart.
By Tom Wike | 2025-12-09

Bryan and Cy - Going Deep Into Games
In an age where folks say starters don't go deep enough into games, Bryan Woo joins the Cy.
By Tom Wike | 2025-08-31