"TreeRings 500" by Anecdote Baseball is original reserach.
Tree Rings 500
Featuring members of the 500 HR club as shown relative to their league.
By Tom Wike | June 14, 2025
Table of Contents
Intro
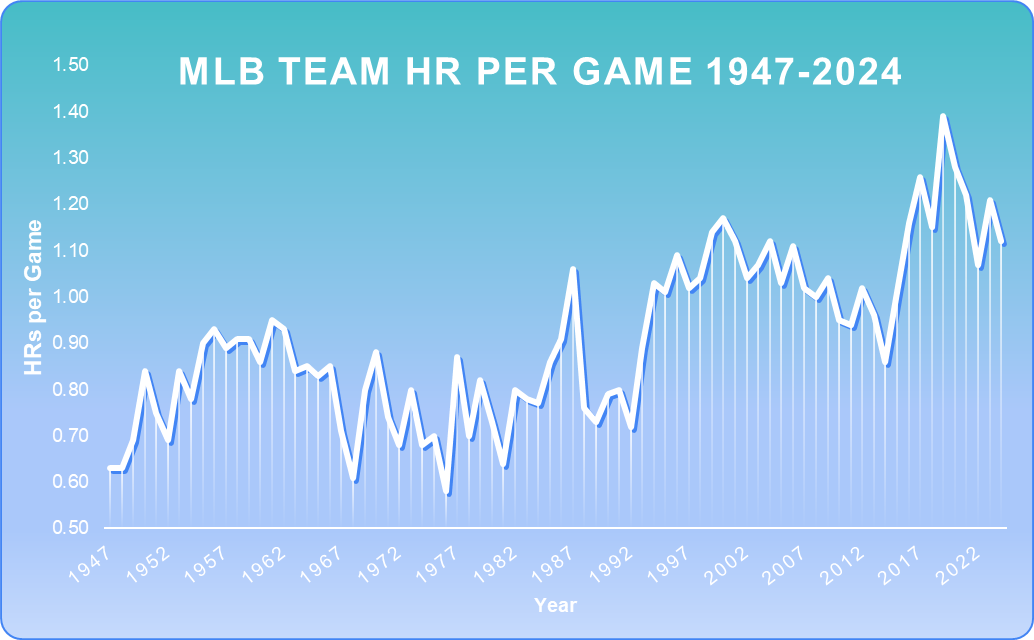
MLB’s 500 Homerun Club rapidly grew in the 1990s and 2000s, chemically aided or otherwise. To some, that growth cheapened the club. How dominant was a slugger just because they topped 500 HR? In an environment rife with performance-enhancing drugs, small ballparks and a retreating strike zone, could a 40 HR season actually be a bad one? Answering questions like these, led to this article.
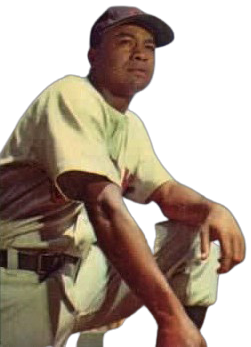
"Dick Allen" by Sports Service 1965 is licensed under Fair Use
Dick Allen and his mythical 1972 season was the first inspiration. He nearly won the Triple-Crown, hitting .317 with 37 HR and 117 RBI. Relative to the league “meta,” or run-scoring environment of '72, that's an enormous performance, just like it would be today. Still, 37 Homeruns is probably a bit different between 1972 and 2020. The folk-tale mythology taught to me about that season, resulted in one of the first Excel gizmos designed to be used on this baseball website.
An appropriate follow-up to this chart is some of the best “Tree-Rings” performers of a different cut-off: 300-499 career HR. Then, we might know if our base-10 reptilian brains are unfairly keeping folks like Fred McGriff out of the Hall-of-Fame. Spooky stuff indeed.
Methodology
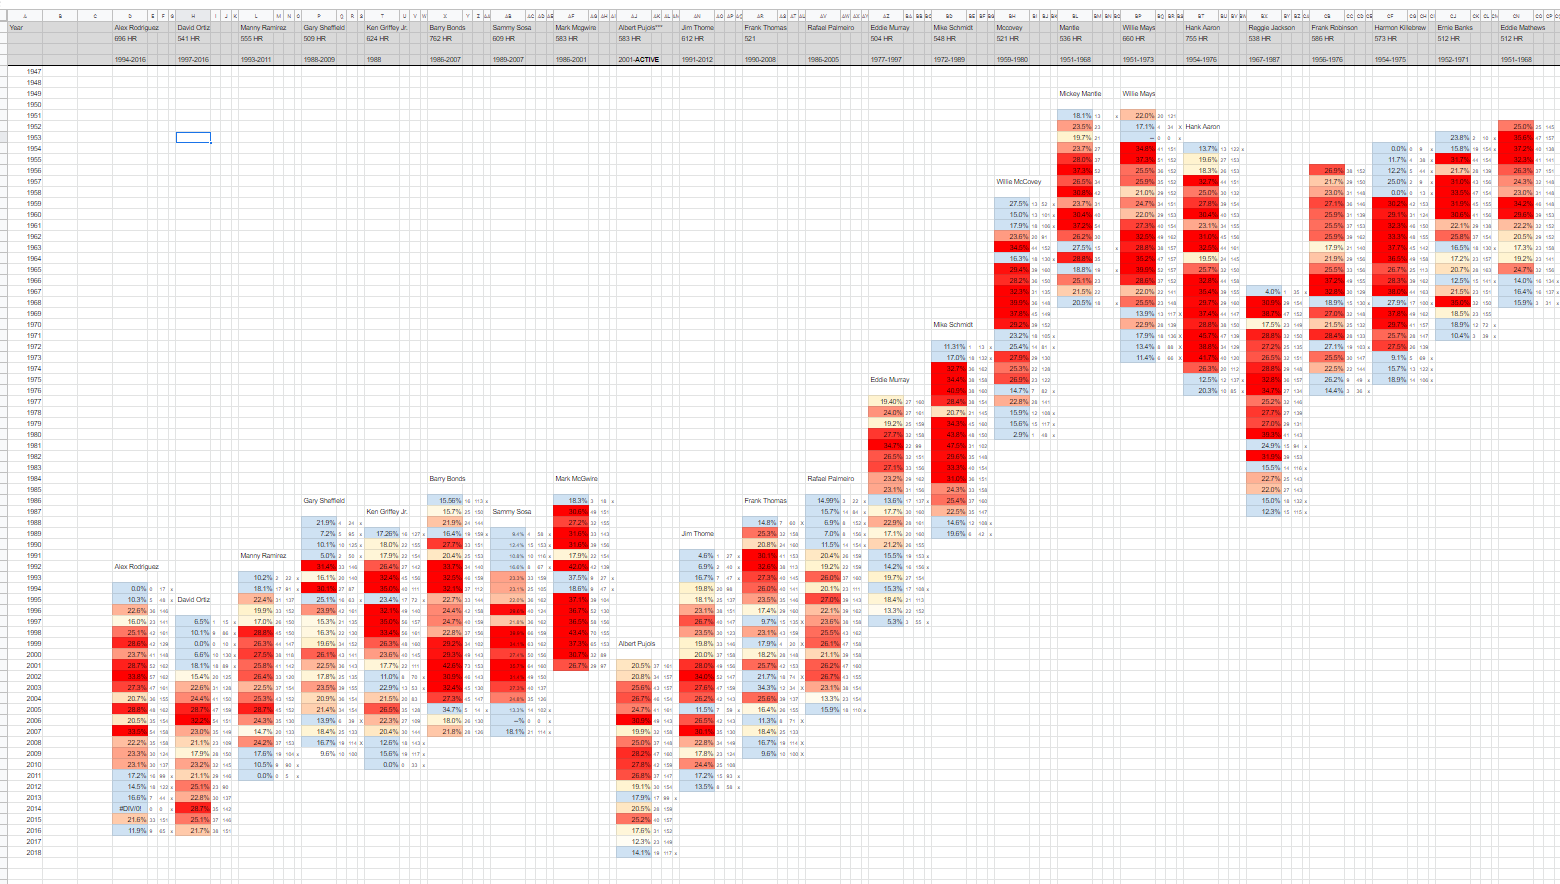
The chart below shows every player since 1947 who has topped 500 Homeruns. Their order is something between chronological and just pairing related guys (Sosa->McGwire->Pujols). You’ll have to scroll down right away, because A-Rod didn’t play in the 1950s, where the top of the chart is.
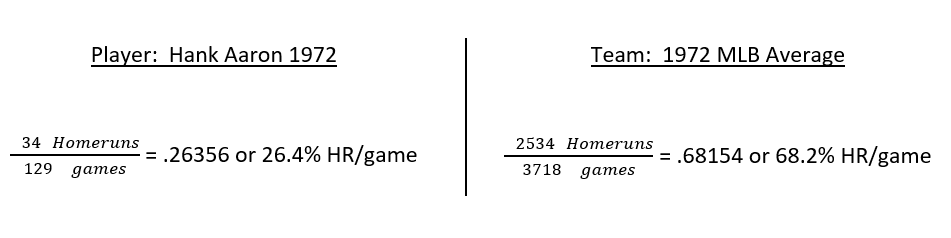
Each player's score for a given season is their heat-mapped HR share %, or Tree Ring. It represents how much of an average team’s HR output that player contributed. Each player has a HR/game ratio for each year, and that score is divided against that year's average TEAM’s HRs/game.
So, if the league-average team hit exactly 1.00 HRs per game, like was the case in 2008, and a player hit 40 HRs in 160 games (or 1 every 4 so 25%), they would be averaging .25 HR of the team’s average 1.0 per game, or 25%. Easy enough. If a player hit 40 HRs in a much tougher hitting environment, like 1972, where teams only averaged say .68 HRs per game, their score would be much better. (.25 HR/game for the player divided by .68 HR/game for the team = 36.76%)
Notice how the player's score is not per 162 games, but games played for that individual. Seasons totaling less than 20 HRs are colored light blue and marked with an X, as any good score with a sub-20 HR season be a function of a low number of games played for that player. At least in modern baseball.
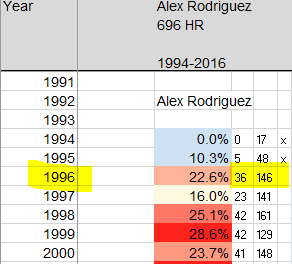
Here is Alex Rodriguez's 1996 season shown as an example. 36 and 146 represent Homeruns and games played for A-Rod. The last number needed to produce the heat-mapped Tree Ring % (which was 22.6% for A-Rod in 1996)') is League HRs per game for the season, which can be found in the 2nd table at the bottom of the workbook. Unfortunately, when I created this framework, I used data for HR/game for teams that only goes to the hundredths place, whereas my Hitter data goes to the thousandth. An oversight, albeit a tiny one.
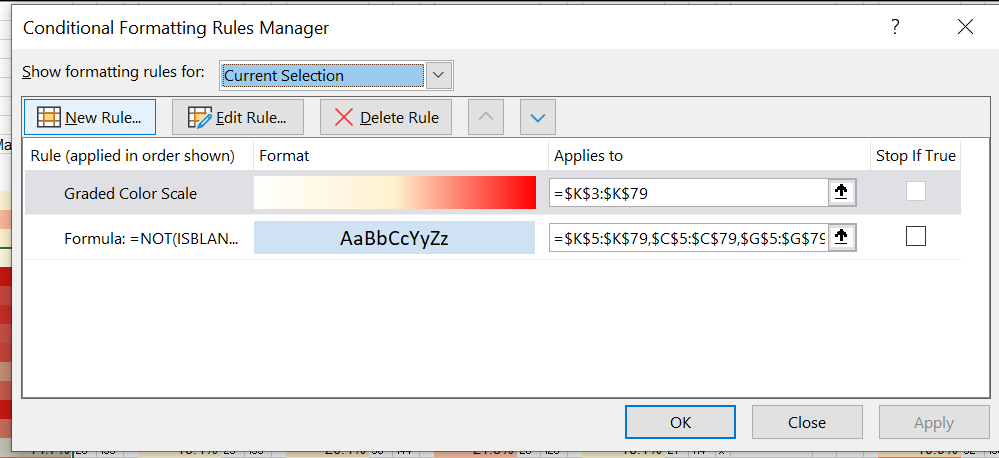
The scale or tiers for the heat-mapped Tree Ring scores are .1/.2/.3 with colors of white, light yellow and red. Anything steeper like .1/.25/.4 showed a lot more muted results, as 30% of an average team’s homerun total is pretty huge.
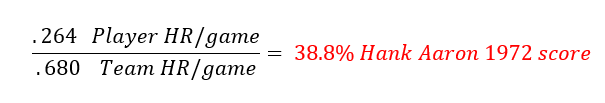
Remember, 22.2% like Alex Rodriguez's 35 HR 2008 season means that in an average game he played, he produced about 22% of his team’s HR production, similar to his 22.6% score in 1996. In 1972, Hank Aaron had a score of 38.8%.
Example
Divide the player's average into a Team's average.
For Dick Allen's part in all of this, and for being a dominant hitter worthy of the Hall of Fame, he is included. His stretch of consistently topping 25% of a team's output and scoring impressively against the 500 HR Club speaks for itself.
***update*** In December 2024, Dick Allen was elected to the Baseball Hall of Fame after receiving 13 of 16 votes from the Classic Era Committee.
***update*** In July 2023, Fred McGriff was elected to the Baseball Hall of Fame after receiving 16 of 16 votes from the Contemporary Baseball Era Committee.
Chart
Original chart by Anecdote Baseball
placeholder Caption and link text
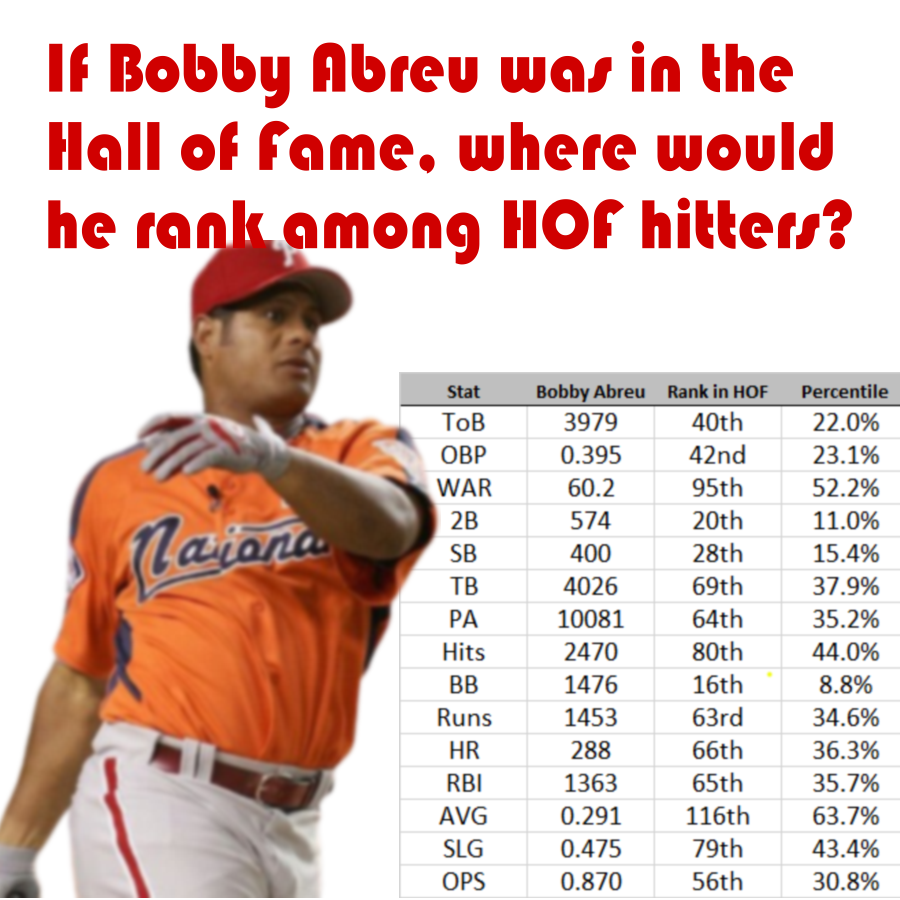
Great Hitter: But is it enough?!?!
We're spitting limerics here. Forlorn is the the fate of this mortal prefered to many HOFers.
By Tom Wike | 2026-02-04
MLB Buckets - 2024 and 2025
Hitters by 1/10th. 182k Plate Appearances split 10 ways.
By Tom Wike | 2026-01-21
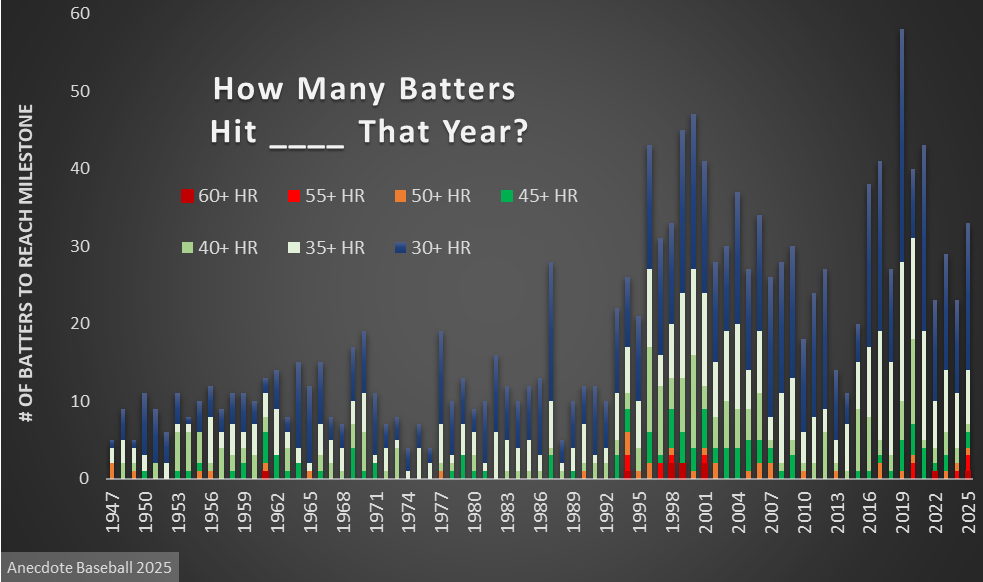
2025 HR Milestones
With 2025 data in tow, we update the big Home Run demography chart.
By Tom Wike | 2025-12-09
Bryan and Cy - Going Deep Into Games
In an age where folks say starters don't go deep enough into games, Bryan Woo joins the Cy.
By Tom Wike | 2025-08-31